![]()
Software de supervisión de
tiempo de actividad de PRTG

Compruebe el tiempo de disponibilidad de todos sus servidores: servidor FTP, de correo electrónico, DNS, SQL,
servidores virtuales
PRTG supervisa la disponibilidad de su sitio web
Determine la causa
de los bloqueos
PRTG ofrece un sistema de creación de informes integral que in-cluye datos estadísticos, gráficos y mucho más
¿Sabe qué está buscando?
Ahorre tiempo y salte al tema de su elección
- Definición: tiempo de actividad es redes de ti
- Supervisión del tiempo de actividad: por qué PRTG es la elección acertada
- Su meta: ¡conseguir casi el 100 % de tiempo de actividad con PRTG!
- Medición del tiempo de actividad: mantenga su vista sobre todo
- Sensores perfectos para la supervisión del tiempo de actividad
Definición: ¿Qué significa tiempo de actividad para las redes informáticas?
El término "tiempo de actividad" o "tiempo en línea" se utiliza en TI para definir el período de tiempo en el que un sistema informático es funcional y se encuentra disponible. Cuando se refiere a una red, el tiempo de actividad se puede definir como la disponibilidad y fiabilidad de servidores y dispositivos, o la de los dominios y sitios web. La mayoría de las veces, la disponibilidad se muestra como un porcentaje. Un tiempo de actividad del 90 %, medido en el transcurso de un día, quiere decir que su sistema estuvo funcional y disponible durante exactamente 1296 minutos (21,6 horas) en ese día en particular.
Supervisión del tiempo de actividad: por qué PRTG es la elección acertada
![]() ¿Qué es un sensor en PRTG?
¿Qué es un sensor en PRTG?
Un sensor es cada uno de los aspectos que se pueden monitorear en un dispositivo, como por ejemplo el tráfico de un puerto en un switch, la carga de la CPU de un servidor o el espacio libre de un disco duro. Se necesita una media de 5-10 sensores por dispositivo o un sensor para cada puerto de switch.
![]()
Puesta en marcha sin costes
La versión básica de PRTG es gratuita, con 100 sensores sin caducidad. Durante los primeros 30 días, incluso puede disfrutar de la versión completa con su número ilimitado de sensores para obtener una idea mejor de cómo funciona PRTG. Tome el periodo de prueba de nuestra herramienta de supervisión de red y averigüe cómo puede usarla para supervisar su disponibilidad y evitar costosos tiempos de inactividad.
![]()
Supervisión desde un mismo punto
Muchas compañías supervisan sus sistemas mediante una conjunción de soluciones dispares. Mezcle todo eso con las demás funciones internas de TI y tendrá una receta infalible para la confusión y, a veces, el desastre. Pero, con PRTG, conseguirá una herramienta de supervisión central e integral para la supervisión de TODOS sus sistemas. PRTG es fácil de configurar, apenas requiere ancho de banda y simplifica su trabajo día a día.
![]()
llegue directamente a la causa raíz
Con PRTG, usted disfrutará de una vista completa de toda su infraestructura de TI. No solo mantiene un registro de su disponibilidad y del tiempo de inactividad sino que también puede determinar las causas de los incidentes. ¿Qué produjo realmente la caída de la red? ¿Fue el hardware, la conexión de red o una configuración defectuosa? Gracias a PRTG, ahorrará tiempo en la resolución de problemas.
![]()
Notificacions inmediates
Un sistema de notificación personalizable envía rápidamente las alertas pertinentes para que pueda corregir los errores antes de que surjan problemas más serios. ¡No espere para apagar el fuego, deténgalo antes de que se prenda la llama!
![]()
Informes exhaustivos
PRTG cuenta con un sistema completo de informes con estadísticas, gráficos y mucho más. Cree informes personalizados y envíelos a sus superiores de forma automática. Utilice estos informes para ver cómo y dónde se almacenan sus recursos.
![]()
Perfectamente compatible
PRTG ofrece sensores de supervisión (puntos de medición predefinidos) para prácticamente todos los fabricantes de dispositivos, incluidos Cisco, Dell, Oracle y HP.
![]()
Mayor predictibilidad
La supervisión integral le permite tomar todo el control. Aprovéchese de una base de datos fiable para optimizar la distribución de la carga o planificar la expansión de su red.

Su meta: ¡conseguir casi el 100 % de tiempo de actividad con PRTG!
Cuando se trata del tiempo de actividad, solo le vale un porcentaje: ¡99,999! Estos "5 nueves" son el paraíso de la disponibilidad de su red. PRTG puede ayudarle a alcanzar ese ambicioso objetivo. ¡En esta página, le presentaremos las ventajas de supervisar el tiempo de actividad con PRTG, los sensores que proporcionamos y algunos de nuestros consejos sobre cómo supervisar la red!
Un vistazo rápido a PRTG: supervisión del tiempo de actividad
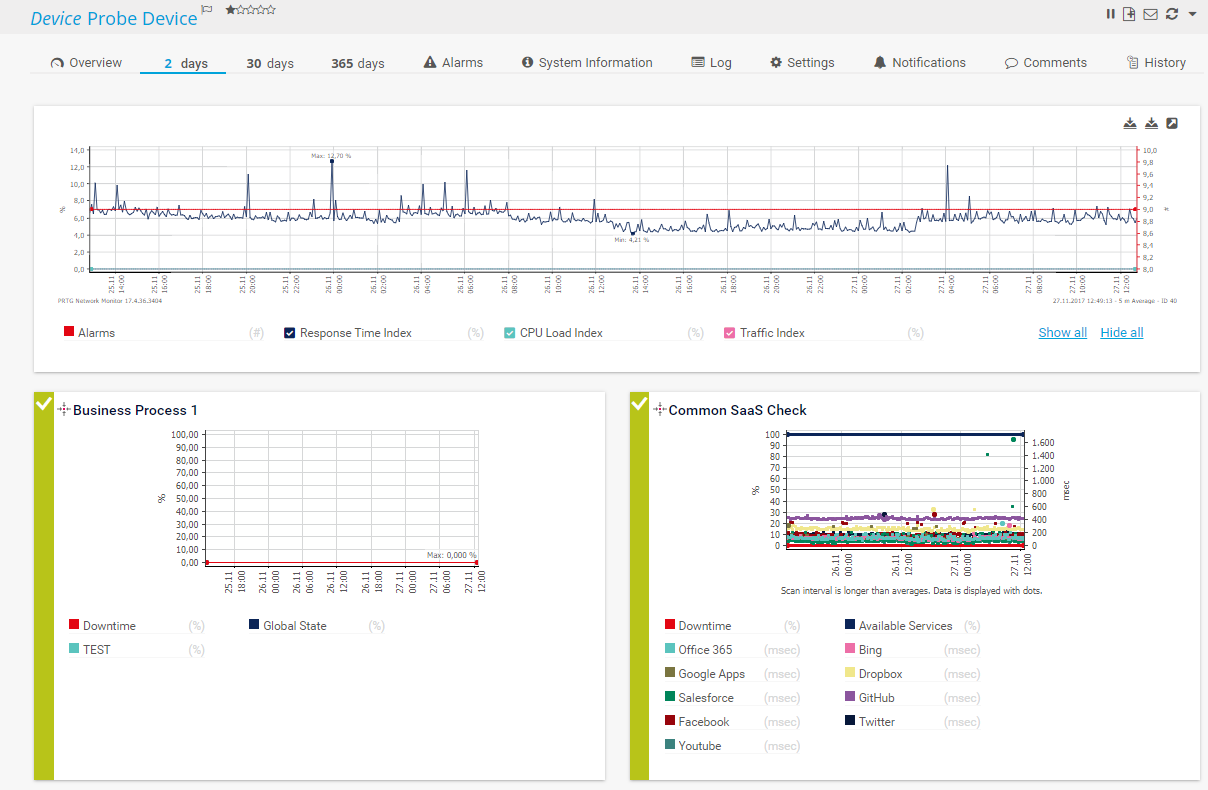
Supervisión Gráfico de ejemplo para las estadísticas de supervisión sobre la disponibilidad

Sunburst de PRTG
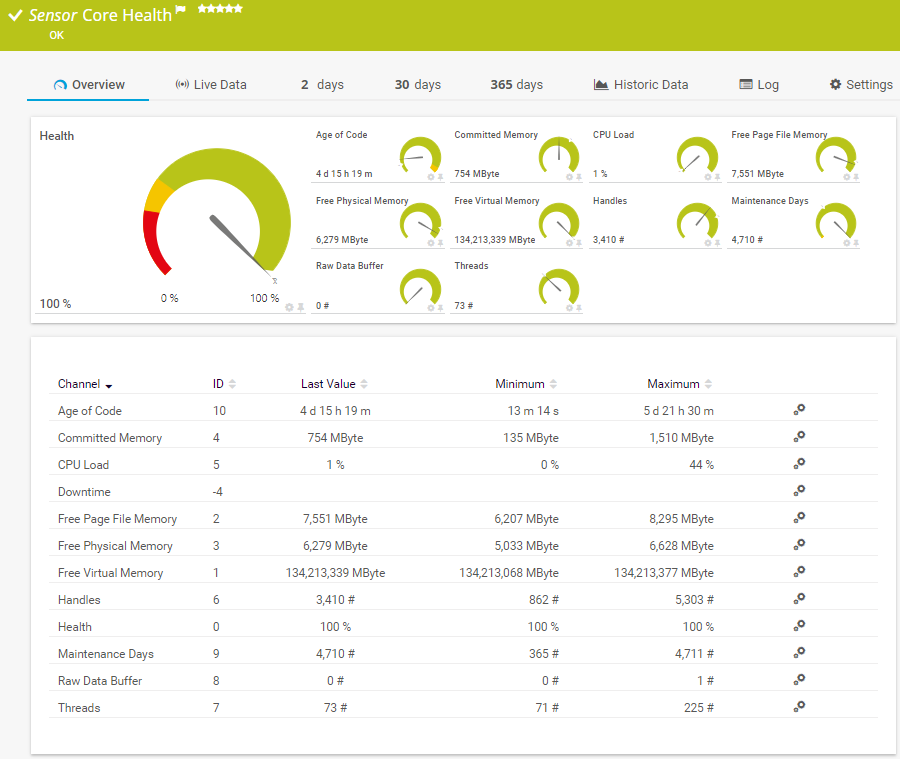
Salud del servidor central
Medición del tiempo de actividad: mantenga su vista sobre todo
![]()
Tiempo de actividad de
sus servidores
Con PRTG, puede comprobar el tiempo de funcionamiento de todos sus servidores. Tanto si se trata de CDN, de servidores FTP, de correo, de servidores web como IIS, DNS, SQL o virtuales (como VMware o Hyper-V), PRTG lo supervisa todo. Por defecto se supervisa la carga de CPU, la memoria, el ancho de banda y muchos otros parámetros del rendimiento del servidor. Para obtener más información, consulte nuestra página acerca de la disponibilidad de sus servidores.
![]()
Tiempo de actividad
de dispositivos
Cuando sus compañeros de trabajo se quejan de que sus dispositivos funcionan mal, muchos administradores se embarcan en una larga búsqueda para encontrar el culpable. ¿Es un error en la red o en el dispositivo del usuario? Con PRTG, puede comprobar las funciones de cada dispositivo individual, ya se trate de un ordenador de sobremesa, un router, un switch u otro componente de la red. Para obtener más información, visite nuestra página acerca de la supervisión del hardware con PRTG.
![]()
Tiempo de actividad
de sus sitios web
Para muchas empresas, la disponibilidad de su página web es un factor vital en su rendimiento de ventas. Cada segundo que una empresa se encuentra fuera de línea es un segundo en que los clientes no pueden navegar por sus productos o realizar pedidos. Con PRTG, usted no solo supervisará la disponibilidad, la velocidad y el rendimiento de sus bases de datos, sino también el contenido individual de su sitio web. Para más información, consulte nuestra página sobre la disponibilidad de su sitio web. Cuando se trata de la disponibilidad de sus dominios, los problemas suelen ser los mismos.
Preguntamos: ¿Recomendarías PRTG?
Más del 95% de nuestros clientes dicen que sí.
Paessler AG realizó pruebas en más de 600 departamentos de TI de todo el mundo para ajustar
su software de monitoreo de redes a las necesidades de los administradores.
Un resultado de la encuesta: más del 95% de los participantes recomendaría PRTG o ya lo han hecho.


“El apoyo que recibimos de Paessler AG fue totalmente tranquilizador. Su tiempo de reacción, sus conocimientos y las soluciones propuestas fueron sobresalientes en todos los departamentos.”
Andreas Reimann, Arquitecto Superior de Redes de Comunicación en el aeropuerto de Zúrich. El aeropuerto de Zúrich utiliza más de 4500 sensores para supervisión
500.000 usuarios confían en nosotros y
los expertos nos reconocen como líderes del sector

“Fantástica solución de supervisión de redes e infraestructura, fácil de implementar pero aún más fácil de usar. Simplemente, el mejor sistema disponible.”

“El software es absolutamente perfecto, y su servicio de asistencia es superior. Cumple con todas las necesidades y requisitos. Se trata de una solución imprescindible para quien necesita cualquier tipo de supervisión.”

“La herramienta destaca en su papel principal de ser un servicio unificado de administración de infraestructura y supervisión de red.”
PRTG le facilita el trabajo
Nuestro software de monitoreo le libera para que se pueda concentrar en otras tareas notificándole de inmediato sobre posibles problemas.
![]()
Ahorre esfuerzo
PRTG le ofrece una herramienta de monitoreo central para sus servidores y toda su red. Disfrute de una rápida visión general de toda su infraestructura a través de nuestro panel de control y aplicación.
![]()
Ahorre tiempo
Empezar a utilizar PRTG es muy sencillo. Instalar PRTG o venir de otra herramienta de monitoreo de red es muy fácil gracias a sus plantillas de dispositivos predefinidas y autoconfiguradas.
![]()
Ahorre dinero
El 80 % de nuestros clientes consigue ahorros sustanciales en costos con el monitoreo de la red. Su inversión en licencias probablemente se amortizará en unas semanas.
Su tiempo de actividad de un vistazo – incluso fuera de la oficina
Configure PRTG en minutos y utilícelo en casi cualquier dispositivo móvil.


Consejo práctico: “Oye, Arne, ¿qué les contarías a todos aquellos administradores que quieren utilizar PRTG para supervisar la disponibilidad de sus redes?”
“En cuanto a las listas de sensores y los informes, PRTG ordena inmediatamente entre tiempo de actividad y tiempo de inactividad. Por lo general, el sensor ping del tiempo de inactividad es todo lo que se necesita para obtener una respuesta rápida de lo que sucede. Basta con introducir “pingsensor” y verá de inmediato dónde residen la mayoría de los problemas de su red.”
Arne Seifert trabaja en el departamento de asistencia de Paessler AG.
Sensores perfectos para la supervisión del tiempo de actividad
![]() Ping es una herramienta de línea de comandos que se puede encontrar en prácticamente cualquier sistema operativo con conectividad de red, y sirve como una prueba para ver si se puede acceder a un dispositivo a través de la red. El comando Ping envía una solicitud a un dispositivo específico. Si tiene éxito, muestra la respuesta que el equipo de destino devuelve al de origen.
Ping es una herramienta de línea de comandos que se puede encontrar en prácticamente cualquier sistema operativo con conectividad de red, y sirve como una prueba para ver si se puede acceder a un dispositivo a través de la red. El comando Ping envía una solicitud a un dispositivo específico. Si tiene éxito, muestra la respuesta que el equipo de destino devuelve al de origen.
Leer más
Sensor Ping v2: La manera más fácil de comprobar el tiempo de funcionamiento o la disponibilidad de la red es mediante el uso de un sensor de Ping v2. Para saber más acerca del sensor Ping v2, consulte el manual de PRTG.
Sensor Tiempo de actividad (SNMP) v2: Este sensor predefinido le permitirá supervisar la disponibilidad a través de SNMP y ver el tiempo que un dispositivo ha estado funcionando sin interrupción. SNMP utiliza poco ancho de banda y CPU y, por lo tanto, es una solución de control ideal. Lea más sobre el sensor de Tiempo de actividad (SNMP) v2.
Sensor Tiempo activo sistema Windows: Con este sensor, puede controlar el tiempo de actividad a través de contadores de rendimiento de Windows o WMI (Windows Management Instrumentation) y ver cuánto tiempo ha estado funcionando sin interrupción un equipo basado en Windows. Para obtener más información, consulte el sensor de tiempo de actividad del sistema de Windows. A pesar de que este sensor es muy adecuado para dispositivos Windows, tiende a producir un mayor efecto sobre el rendimiento de su sistema que SNMP.
Otros sensores: Nuestra lista de sensores de PRTG contiene más de 250 sensores predefinidos. Sensores para servidores, ancho de banda, aplicaciones... la selección es enorme y el equipo de Paessler la renueva constantemente.
¡Utilice nuestro Smart Setup! PRTG comienza automáticamente la creación de sensores desde el momento en que se instala. Al hacer ping a un rango de IP privadas, PRTG le permite empezar a vigilar el tiempo de actividad con solo abrir la herramienta de supervisión por primera vez.

También le puede interesar:
Detección de paquetes: PRTG analiza los paquetes de datos y muestra la tase de pérdida de paquetes de datos. En caso de que se sobrepase un valor crítico, recibirá una alerta automáticamente.
Monitorización de impresoras: Con PRTG sabrá el estado de todas las impresoras, podrá ver mensajes de error de impresoras de un vistazo y, si es necesario, sustituir la impresora.
Fortinet Analyzer: Compruebe el estado de sus productos Fortinet y obtenga alertas en cuanto su solución Fortinet identifique
un riesgo de seguridad.
“Fácil de implantar y configurar, con un buen soporte técnico.”
R. v. S., ICT Manager de Heinen & Hopman Eng BV

PRTG: La multiherramienta para el administrador de sistemas
Adapte PRTG individualmente y dinámicamente a sus necesidades y apóyese en una sólida API:- HTTP API: Accese los datos de monitorización y manipule los objetos monitorizados utilizando solicitudes HTTP.
- Sensores personalizados: Cree sus propios sensores PRTG para una monitorización personalizada.
- Notificaciones personalizadas: Cree sus propias notificaciones y envíe desencadenantes de acciones a sistemas externos.
- Sensor REST personalizado: Monitorear casi todo lo que proporciona datos en formato XML o JSON
Todavía no le hemos convencido?
![]()
Más de 500.000 administradores
de sistemas adoran PRTG
Paessler PRTG se usa en empresas de todos los tipos y tamaños. A los administradores de sistemas les encanta PRTG por lo mucho que les facilita el trabajo.
Todavía no le hemos convencido?
![]()
Monitoree toda su
infraestructura de TI
Ancho de banda, servidores, entornos virtuales, sitios web, servicios de VoIP... PRTG vigila
toda su red.
![]()
Pruebe Paessler PRTG gratis
Todo el mundo tiene diferentes necesidades de monitoreo. Por eso se puede probar PRTG completamente gratis. Empiece ahora con su
prueba.
|
PRTG |
Network Monitoring Software - Versión 24.2.94.1400 (April 10th, 2024) |
|
Hosting |
Disponible como descarga para Windows y como solución hospedada PRTG Hosted Monitor |
Idiomas |
Inglés, alemán, español, francés, portugués, holandés, ruso, japonés y chino simplificado |
Precio |
Versión gratuita con 100 sensores. Ver precios de la versión comercial |
Unified monitoring |
Dispositivos de red, ancho de banda, servidores, aplicaciones, virtualizaciones, sistemas remotos, IoT y mucho más |
Vendedores y aplicaciones compatibles |
|