![]()
How to set up bandwidth monitoring
in PRTG in 4 steps
“Who is hogging my bandwidth?” This question keeps coming up regularly. The network is slow and you need to identify the root of the problem.
To determine how much bandwidth your devices and applications are using, you can use different protocols like SNMP, Flow or packet sniffing – depending on your network and hardware.
What's the difference between bandwidth monitoring
via WMI, SNMP, packet sniffing, and Flow?
Check out the PRTG bandwidth monitoring comparison
|
| WMI | SNMP | Packet Sniffer | Flow (IPFIX, NetFlow, sFlow, jFlow) |
|---|---|---|---|---|
| Setup | Medium | Easy | Easy to complex (depending on filter rules used) | Can be complex (e.g., the switch must be configured) |
| Traffic can be filtered |
|
|
| |
| Differentiate bandwidth usage by protocol or IPs |
|
|
|
|
| PRTG can show Toplists (Top Talker, Top Connections, Top Protocols, custom) |
|
|
|
|
| Filter bandwidth usage by IP |
|
|
|
|
| Filter bandwidth usage by MAC address |
|
|
|
|
| Filter bandwidth usage by physical network port |
|
|
|
|
| Monitor network parameters other than bandwidth usage |
|
|
|
|
| CPU load on the machine running PRTG | Medium | Low | Higher, depends on the amount of traffic | Higher, depends on the amount of traffic |
| Excess bandwidth usage of monitoring | Small | Small | None (except when monitoring switch ports are used) | Depends on the traffic |
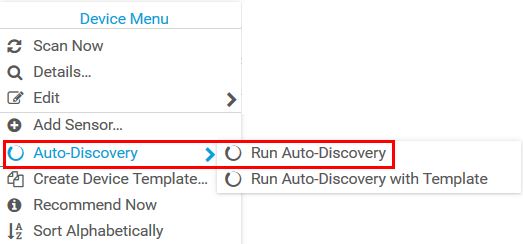
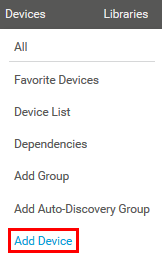
Auto-discovery or creating a device manually
Before you can monitor the bandwidth of your IT infrastructure, PRTG has to “know” all your devices.
- Have you run the PRTG auto-discovery yet? We have a how-to guide that explains the auto-discovery in detail.
- When you install PRTG, the auto-discovery detects and adds devices from your network.
- Is the switch you want to monitor not there? You can also add a device manually.
Basic requirements for SNMP, Flow, packet sniffing, and WMI
SNMP monitoring
The monitored devices must be equipped with SNMP v1, v2c, or v3 (an SNMP-compatible software must be installed on the device).
Keep in mind that SNMP v1 and v2c are no secure protocols. You should not use these protocols if your PRTG installation is reachable via the internet.
SNMP needs to be enabled on the device and the machine running PRTG must have access to the SNMP interface.
Note: SNMP monitoring causes the least CPU load.
Flow (IPFIX, NetFlow, sFlow) monitoring
NetFlow and IPFIX export must be enabled on the monitored device and the router or switch needs to be configured to send Flow packets to the IP address of the PRTG probe system on which you set up the respective Flow sensor.
For choosing a suitable sensor, you also need to know what Flow version (NetFlow V5, NetFlow V9, jFlow, sFlow, or IPFIX) the router or switch sends.
Note: Flow is recommended for high traffic networks and for advanced users.
Packet sniffer monitoring
The router or switch must be configured to send a copy of all network packets to the IP address of the PRTG probe system on which you set up the Packet Sniffer sensor.
Note: Packet sniffing creates the highest CPU load on the system that runs PRTG.
WMI monitoring
DCOM must be enabled on the probe system and on the target system.
You need to enter Windows credentials in the settings of the parent device or group.
The Remote Registry Windows service must run on the target system.
There are a few other basic requirements for using WMI to monitor your network. For more information, see this Knowledge Base article.
Note: Monitoring bandwidth via WMI has a moderate impact on system performance.
SNMP monitoring
With the Simple Network Management Protocol (SNMP), you can gather bandwidth usage data in a very basic way and port by port.
On a single host or server, we recommend that you use an SNMP Traffic sensor to measure the bandwidth used by this specific device.
On a switch or router, SNMP Traffic sensors show the bandwidth usage on a specific port. You need to set up one sensor per port.
As a general rule, we recommend that you
- monitor your core layer switches in a very detailed way,
- the distribution layer in a detailed way, and
- on the access layer switches, you should at least focus on monitoring the uplinks.
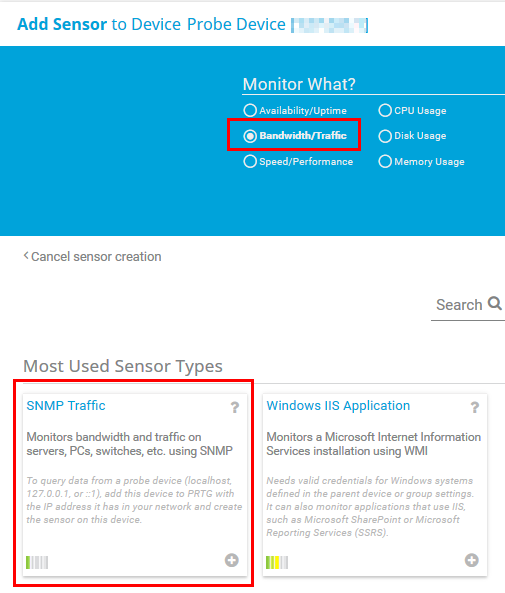
How to do it?
- From the device tree, choose the router or switch you want to monitor
- Right-click the respective device and select Add Sensor from the context menu
- In the Add Sensor dialog, select Bandwidth/Traffic under Monitor What?
- Select the SNMP Traffic sensor
We recommend that you start with the default settings. You can change the settings later at any time.
The SNMP Traffic Sensor of PRTG
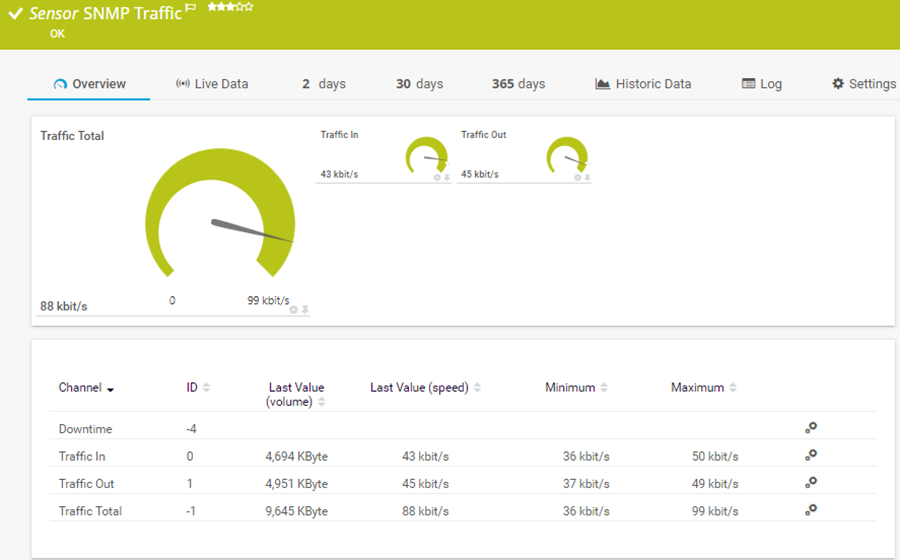
SNMP Traffic Sensor
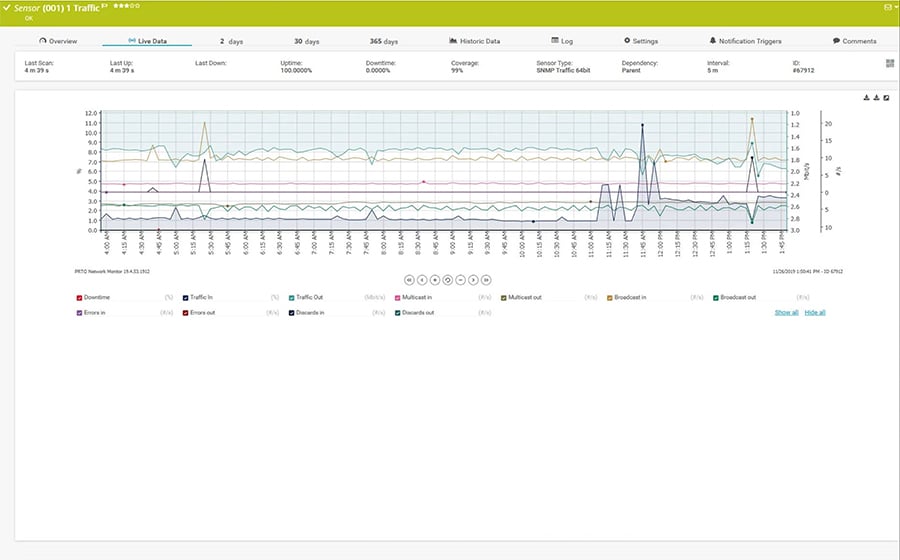
Live graphs of SNMP Traffic Sensor
Flow-based (NetFlow, IPFIX, jFlow, sFlow) monitoring
Flow technologies (NetFlow, IPFIX, jFlow, sFlow) are best suited for Cisco, Juniper, HPE, and other enterprise-grade routers and switches. Flow monitoring is particularly made for larger networks where you need to identify bottlenecks and consumption broken down by IP address to identify the root cause of a bandwidth issue.
You need to add one Flow sensor for each protocol or IP address that you want to monitor.
If you only need to know about current and recent traffic by protocol or IP address, you can also add just one Flow sensor and enable the Toplist feature. For example, you can use the NetFlow v9 sensor to monitor the top talkers, top protocols and top connections on a switch or a router.
How to do it?
- Choose the router or switch you want to monitor from the device tree
- Right-click the respective device and select Add Sensor from the context menu
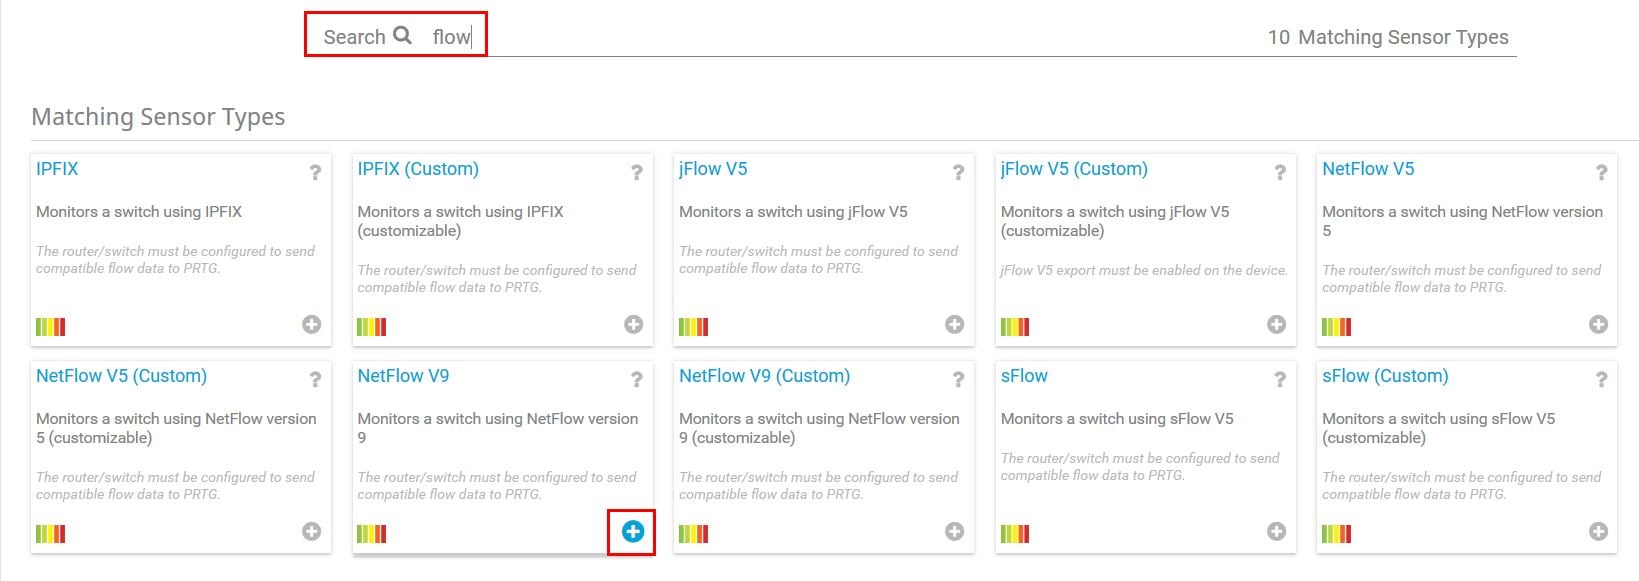
- In the Add Sensor dialog, type "flow" into the search box
- Choose the sensor that matches the Flow version that your device exports and click the plus icon.
- There are two sensors for each Flow version. With the custom sensors, you can define your own channel definitions. Select the non-custom sensors for now
We recommend that you start with the default settings. You can change the settings later at any time.
You can find some additional information about monitoring via Flows in another
how-to guide.
![]()
Test tools
For debugging NetFlow- and sFlow-based configurations, we offer specific test tools that simply dump the data of all Flow packets that a computer receives from an Flow-enabled router.
Packet sniffer monitoring
Packet sniffing is an option ...
- if your network devices do not support SNMP or Flow (NetFlow, jFlow, sFlow, IPFIX) to measure bandwidth usage and
- if you need to differentiate the bandwidth usage by network protocol and/or IP address.
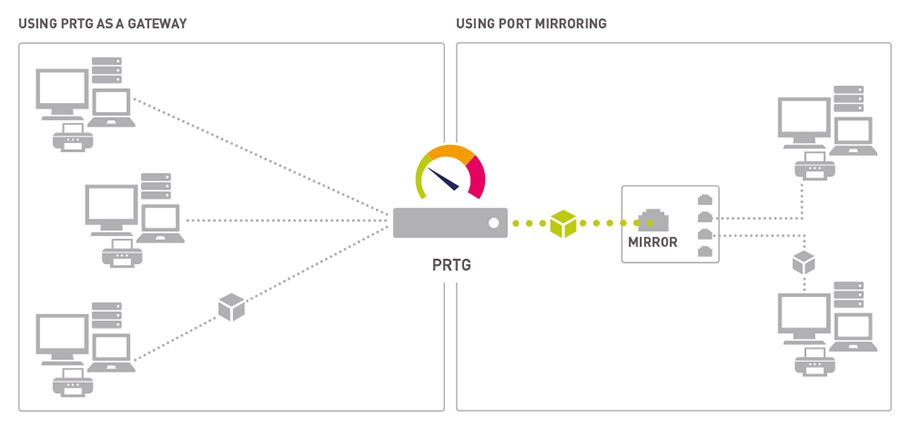
To calculate the bandwidth usage, PRTG inspects every single network data packet
- that passes the network card of a PC (below, shown on the left side in the infographic),
or
- that a monitoring port of a switch (below, right side) sends with its built-in packet sniffer. Use remote probes to set up packet sniffers anywhere in your network and distribute the load on the system.
How to do it?
- From the device tree, choose the device you want to monitor
- Right-click the respective device and select Add Sensor from the context menu
- In the Add Sensor dialog, select Bandwidth/Traffic under Monitor What?, and under Technology Used?, select Packet Sniffing
- Select the Packet Sniffer sensor and set it up as required. You can choose from predefined sensor channels

WMI monitoring
Windows Management Instrumentation (WMI) is a Microsoft technology with which you can monitor and manage Windows-based systems.
Although WMI is not originally intended for bandwidth monitoring, it can be used for this purpose.
The Windows Network Card sensor, for example, monitors bandwidth usage and traffic on a network interface via WMI.
How to do it?
- From the device tree, choose the device you want to monitor
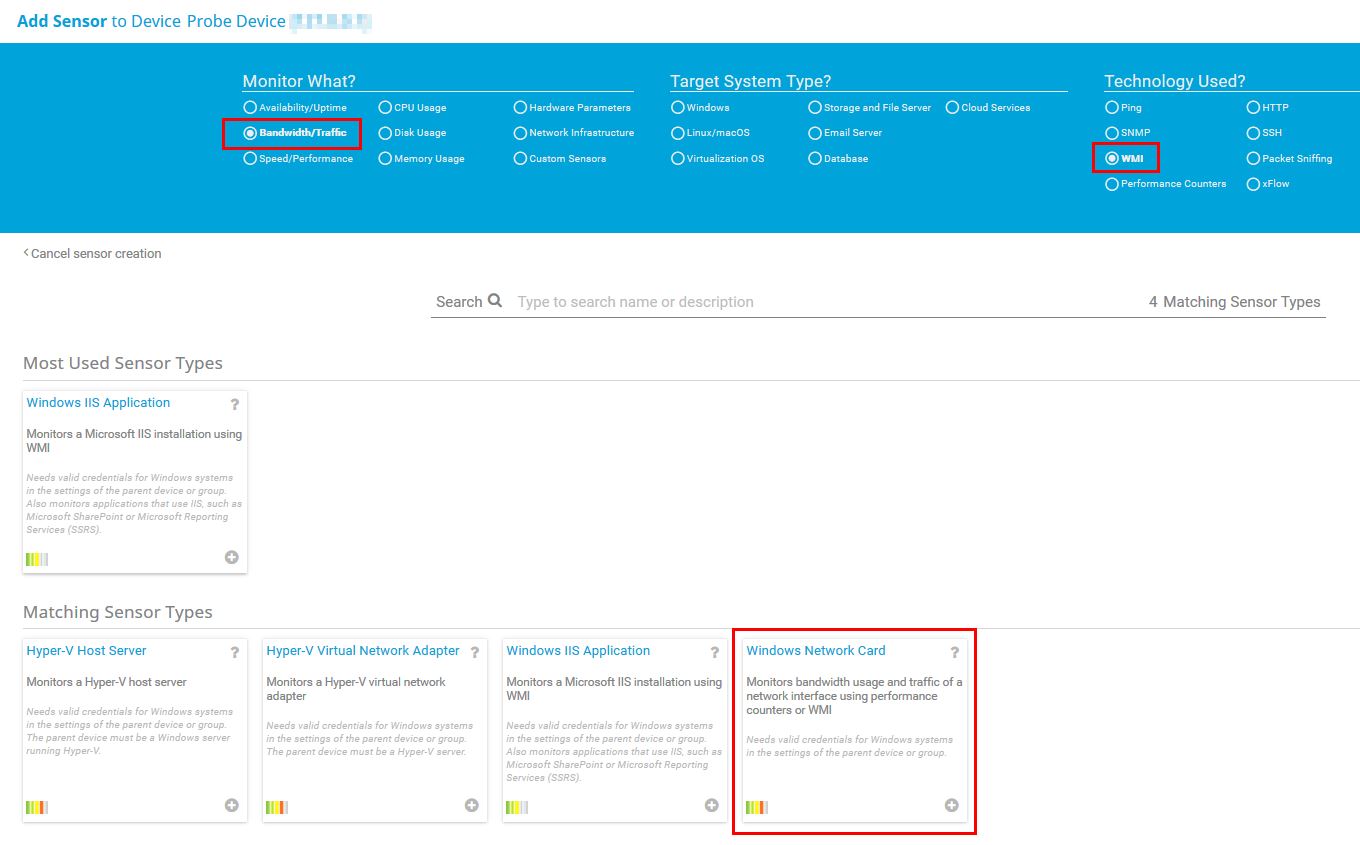
- Right-click the respective device and select Add Sensor from the context menu
- In the Add Sensor dialog, select Bandwidth/Traffic under Monitor What?, and WMI under Technology Used?
- Select the Windows Network Card sensor
We recommend that you start with the default settings. You can change the settings later at any time.
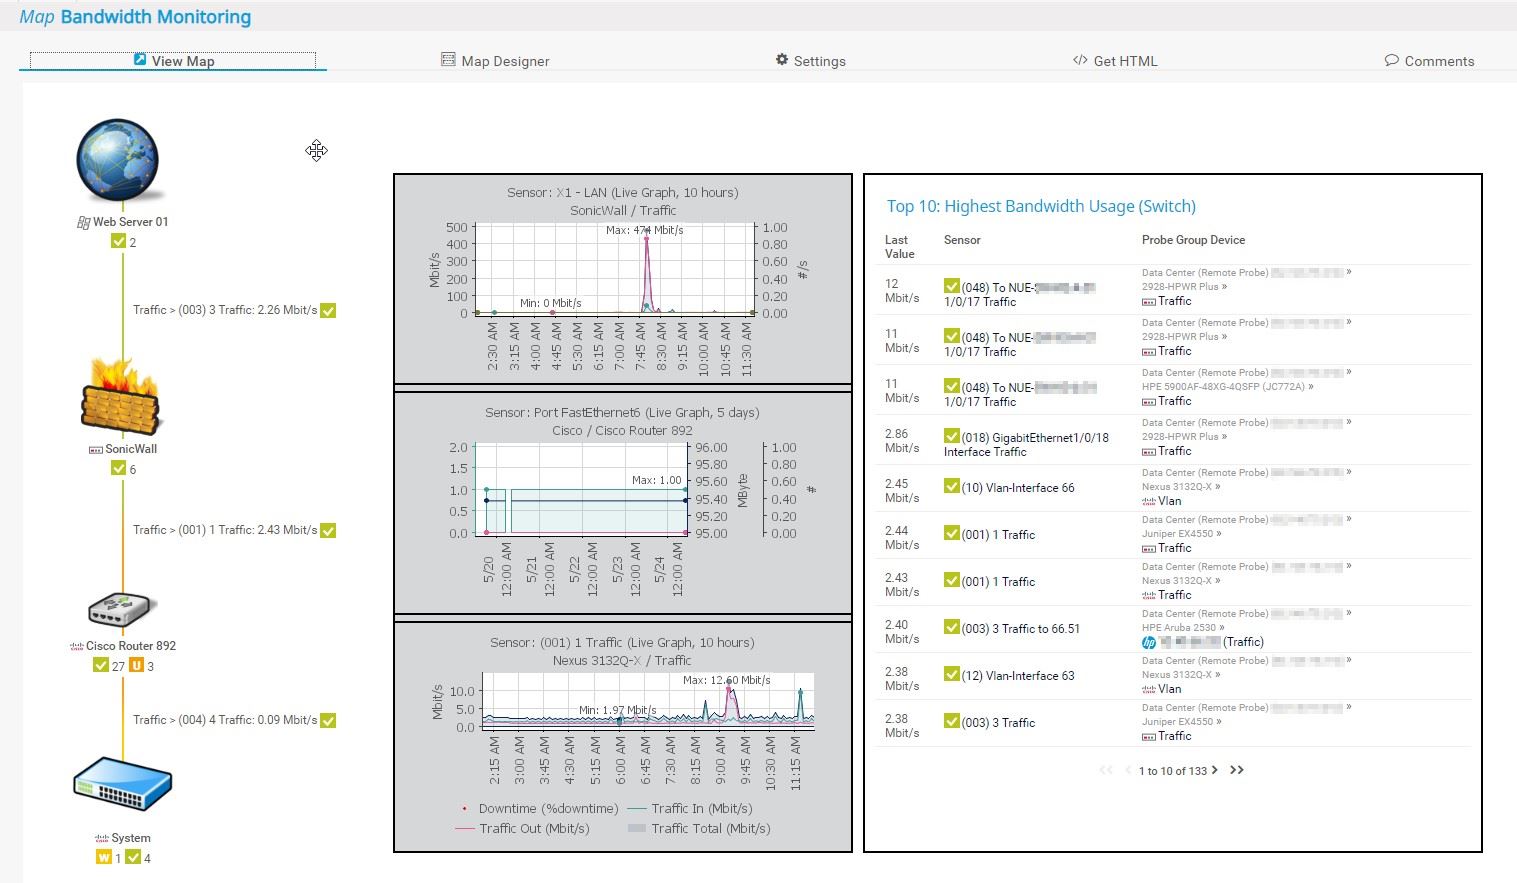
To easily visualize your critical monitoring data or to share monitoring results with colleagues or customers, use PRTG Maps to create dashboards for each interest group.
For example, you can create overview maps for management or detailed maps for administrators.
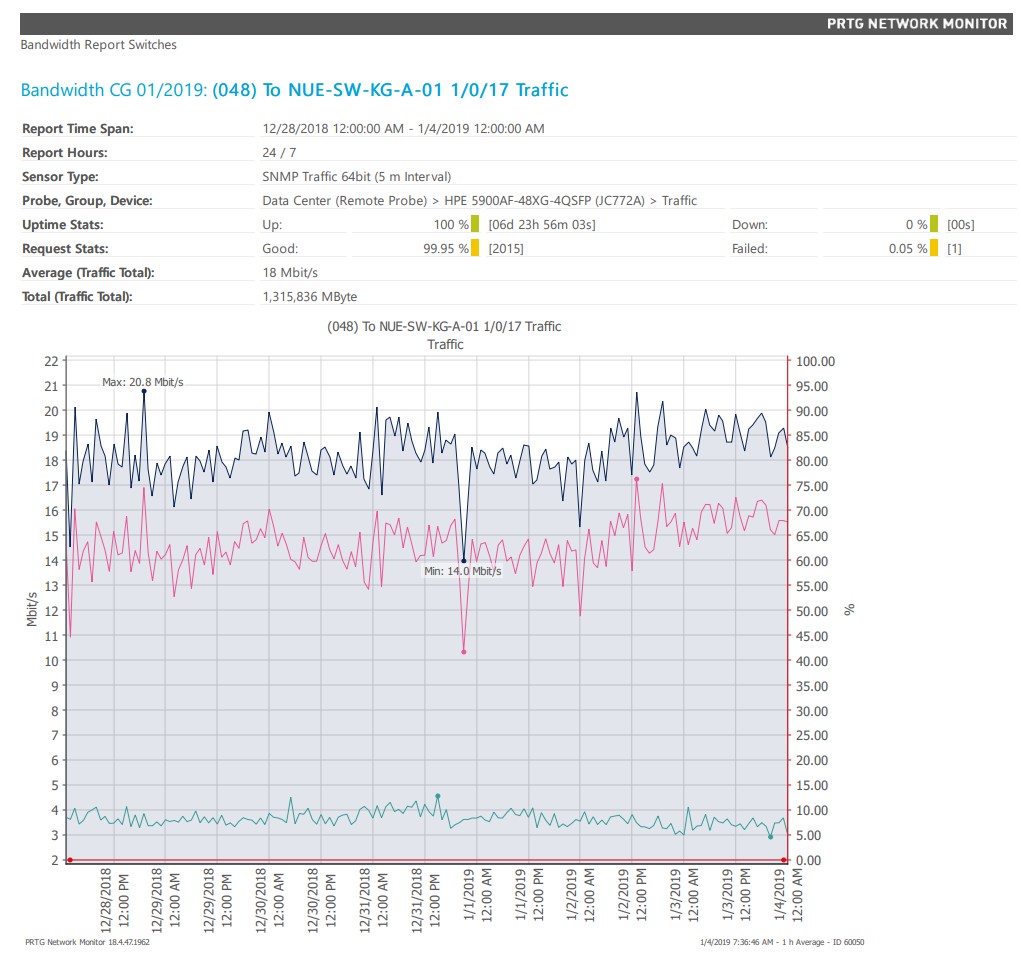
PRTG includes a powerful reporting engine for ad hoc report generation as well as scheduled report generation in HTML, PDF, CSV, and XML format. This means that you can run reports on demand or on a regular basis (for example, once a day or once a month).
Furthermore, you can create reports for a single sensor or for a whole range of sensors.
The content and layout of the report is controlled by the report template of your choice and is the same for all sensors in a report.
This how-to guide only scratches the surface?
Get more deep-dive information here!
Get more deep-dive information here!
Bandwidth monitoring methods
Bandwidth monitoring with SNMP & WMI
Bandwidth monitoring with flows and packet sniffing