![]()
How to monitor
with Flow in 3 steps
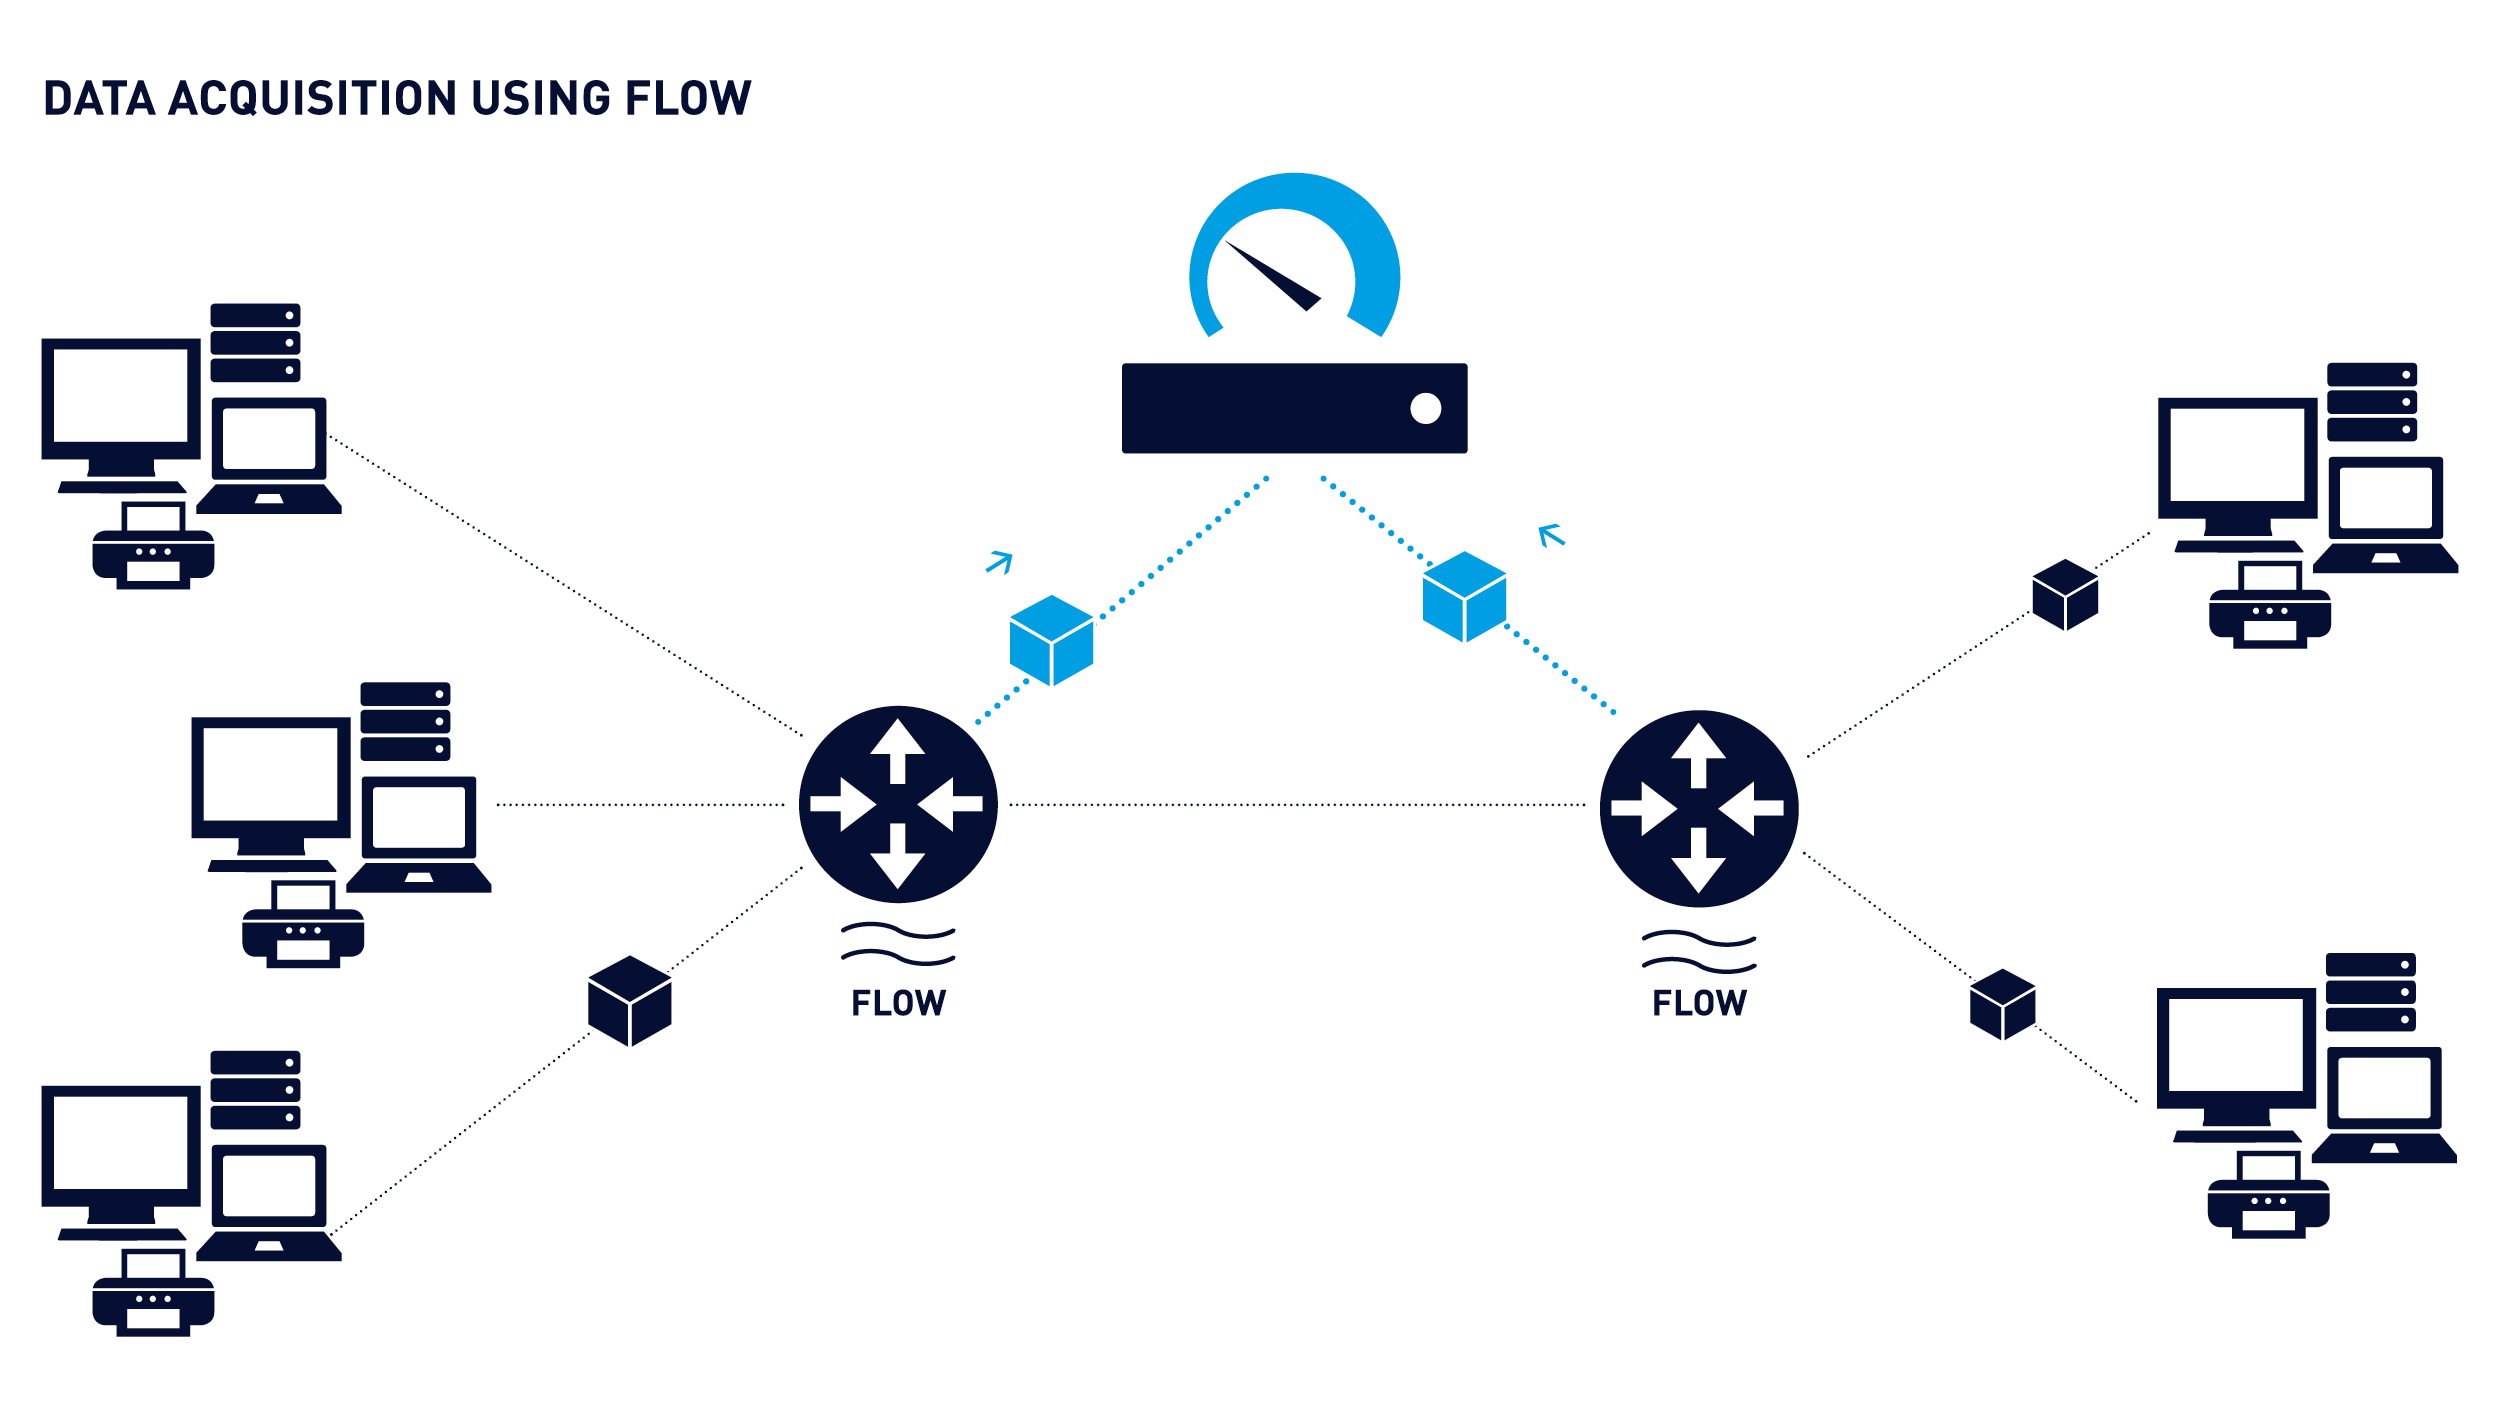
“Flow” is a method of measuring the flow of data between two devices or applications or a sequence of data packets between two endpoints.
There are several ways of acquiring Flow data, but most commonly Flow data is “Exported” by a device where the traffic has to traverse between the two endpoints.
To capture this Flow data, one needs to set up a collector to capture and subsequently analyse that data. The PRTG probe acts as a Flow collector and analyser.
There are several types of devices that produce Flow, these include devices like:
- Routers
- Firewalls
- Switches
- Inline collectors
- Some virtual switches (like VMware and Open vSwitch)
![]()
Identifying bandwidth hogs
Individual sources often use disproportionately high amounts of network bandwidth. These sources may be individual users, but also applications or specific data. With Flow data you’ll be able evaluate IP addresses and get complete traffic related analytics.
![]()
Spot load peaks early
Many companies experience fluctuations in access to various websites or internally-used applications. By defining thresholds, you can be informed early of these events: ideally, before the performance of your system takes significant hit.
![]()
Avoid backup overloads
Thorough backups can lead to problems for the entire network. Such problems are frequently the result of individual routers or switches which overload during the backup and thwart the entire network. Flow data can be used to monitor the traffic and bandwidth usage end-to-end in order to find the causes, and ultimately help you optimize your network.
Configure your Flow generating device (exporter)
Firstly, you need to configure your Flow generating device (like a router or switch) so that it exports and sends Flow data to a computer running a PRTG probe. Pay special attention to the Flow version which is exported since a compatible sensor must be used for traffic analysis and bandwidth monitoring via NetFlow in PRTG.
Some things you need to consider when doing the Flow device configuration include:
What to export
This is usually configured based on the interface where the traffic enters and leaves the device.
How to export
The protocol to be used will be determined by what the device supports. Generally, the standard port for this protocol should be used (for example IPFix:4739, sFlow:6343, NetFlow:2055, jFlow:9996). It is also recommended to set the source address that the exporter should use when sending packets (take note that for “sampled” protocols, you should make note of the sampling interval as well).
Where to send it
Enter the IP of the of the PRTG server or the Remote Probe closest to the exporter. Remember that some devices, like Firewalls, have security restrictions, which means that you will be required to configure the firewall to allow packets through.
Some important things
On the Exporter, pay special attention to the following configurations
Exporter source address
The exporter source address is the interface address the data is coming from. Unless you set it, the device is free to use any interface address it controls as the source.
Usually it is not a problem, but this may cause unexpected results. Notably it often causes confusion with firewalls where the source address is an external address.
Target Port
The source/destination port must be matched on the Exporter and the Collector (the PRTG Flow Sensor).
The interfaces that are included in the export
On most devices, you can pick which devices you want to collect and export data for. Make sure you include all the interfaces with traffic of interest.
Note
The configuration of the Flow Export for a particular device is dependent upon the device type and/or operating system (OS), and thus these are too numerous to go through in this article.
A lot of information on the topic is available in our Knowledge Base, and one of our partners Plixer (the makers of Scrutinizer) has a great guide to configurating Flow on a wide range of devices.
Create a Flow sensor (collector)
on your PRTG installation
What do I need to do in order collect the exported Flow data?
![]()
PRTG needs to be installed on
a server with a configured PRTG Probe
![]()
Add the Flow device in question
![]()
Add a PRTG Flow sensor (Collector) that
matches the Protocol of the Exporter
Two variations of each Flow sensor
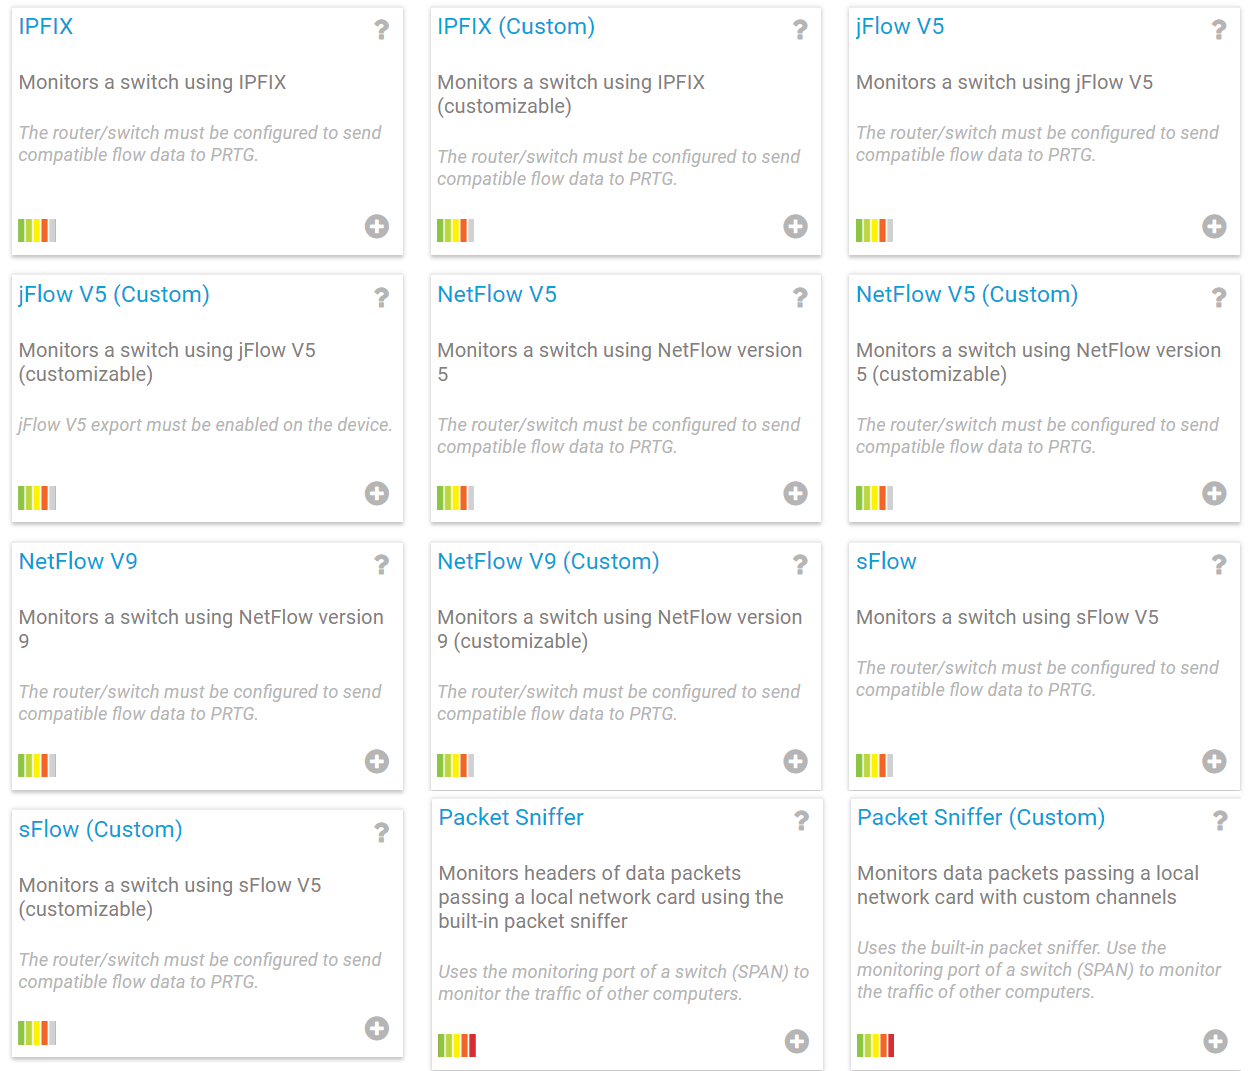
Now you may be asking yourself: “There are 2 variations of each flow sensor, which sensor should I choose?”
There are two main classes of Flow, Statistically Sampled (jFlow/sFlow) or a True Flow (IPFix/NetFlow) which is a 1-for-1.
Which Flow protocol you use is usually determined by the vendor of the device doing the collecting, generally most vendors only support one protocol type.
Next, if you have a specific list of traffic types you want to collect, then use the Custom sensor type for the selected protocol (see also the filter rules), else just use the Standard flow sensor for the protocol in question as Paessler’s programmers have created rules to cover the most common traffic types.
Detailed information on the configuration of the individual Flow sensors can found in their respective manual pages.
In case you want to sum up the Flows from various network devices into one Flow sensor, just add the Flow sensor on your probe device of your Local Probe or Remote Probe in PRTG.
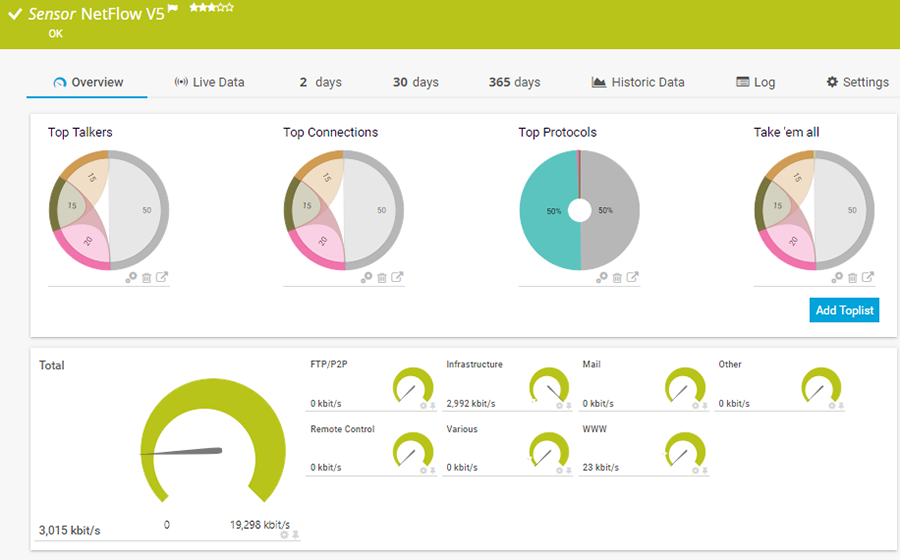
Once everything is set you should get valuable data which by default is displayed in Toplists in PRTG.
These Toplists display the traffic analysis within the sensor among
- Top Talkers (bandwidth used according to IP address),
- Top Connections (according to connection), and
- Top Protocols (according to protocol).
With Toplists, you get a categorized overview which makes NetFlow traffic analysis easy. You are able to create your own custom Toplists, however, please check our manual for performance considerations.
Closing thoughts
A key consideration for all of Flow collectors is that the packets come in from the exporters in a consistent and predictable manner.
PRTG is designed to collect data to make you aware of what is going on in your infrastructure and to alert you when certain thresholds are met.
To give an overview of the flow of data through your network, PRTG summarizes the collected Flow data into segments of 15-minute intervals. The 15-minute intervals are a good compromise between storage consumption and insight.
If you need more detail than the 15-minute intervals, our partner Plixer has a product that integrates with PRTG and gives all the details. They also have a web page with configuration details for most devices that are capable of producing Flow.
If you do not have a device capable of exporting Flow, there are other options. PRTG does have a Packet Sniffer sensor which is capable of collecting data on a network interface of the PRTG Core or Probe server. For details on the PRTG Packet Sniffer, please have a look at the PRTG Packet Sniffer sensor.
This how-to guide only scratches the surface?
Get more deep-dive information here!
Get more deep-dive information here!