![]()
How to set up
web server monitoring
in 3 steps
- Keep it simple – before you start your web server monitoring, pinpoint the real critical spots in your infrastructure
- Do multi-site monitoring (= monitoring from multiple locations) to have additional information about your service
- Use the auto-discovery function to find changes in your IT environment easily
- Set thresholds to your measurements
- Define notifications and escalations steps for service critical issues
- Visualize your KPIs for fast detection of issues or problems
Layer 1
User experience level
PRTG offers the following sensors for monitoring content and user experience.
HTTP
These sensors can be used to make sure the website is reachable, also from different locations, and the content is delivered correctly.
- HTTP Advanced Sensor
- HTTP Content Sensor
- HTTP Full Web Page Sensor
- HTTP Push Data Sensor
- HTTP Transaction Sensor
- HTTP XML/REST Value Sensor
- Cloud HTTP v2 Sensors
- REST Custom Sensor
Specific Services and Application
Get more information about your web servers performance metrics with vendor-specific sensors like:
- HTTP Apache ModStatus PerfStats Sensor
- HTTP Apache ModStatus Totals Sensor
- Windows IIS Application Sensor
Layer 2
Supporting tasks level
PRTG provides several sensors that can be used to monitor each of the following tasks.
Security
As security is one of the most important parts of your IT infrastructure, you should know how long your SSL certificate is valid.
- SSL Security Check Sensor
- SSL Certificate Sensor
Authentication and Re-directing
If you provide content and services which needs authentication, make sure this is working and also that your re-directing works as expected.
- HTTP Transaction Sensor
Error Status Codes
Always know your HTTP response codes and create custom notifications for faster troubleshooting
- EXE/Script Advanced Sensor (find a Knowledge Base article here)
Logging and Backup
In case a disaster recovery is needed, you will be happy if the logging and backup worked in the past.
- File Content Sensor
- Backup monitoring
- Google Analytics Sensor
Layer 3
System or IT level
At the system/IT level of web server monitoring you monitor hardware devices such as web servers,
application servers, database servers, and network devices such as switches and firewalls.
The PRTG sensors are divided into two sections.
Server Health Sensors
Database
A fast and accessible database is important for your business processes, make sure it is up and running smoothly with our database sensors:
- Microsoft SQL v2 Sensor
- MySQL v2 Sensor
- Oracle SQL v2 Sensor
- PostgreSQL Sensor
There are more sensors, but for the same databases.
Server Hardware Health
- Ping v2 Sensor (Availability)
- SNMP CPU Load Sensor/Windows CPU Load Sensor
- SNMP Memory Sensor/WMI Memory Sensor
- SNMP Disk Free v2 Sensor/WMI Free Disk Space (Multi Disk) Sensor
- SNMP Library Sensor (custom OID)/WMI Custom Sensor and many more
PRTG provides out-of-box sensors for monitoring physical servers including Dell, HP, IBM and other as well. For more information, please check our list of all available sensor types.
Services
The foundation of your web server application are not only available resources but the running services:
- WMI Process Sensor
- SSH Script Sensor
- SNMP Windows Service Sensor
- WMI Service Sensor
Network access to base services
Make sure, your web services are accessible over the network
and delivered to your customers without degradation.
Traffic
- SNMP Traffic Sensor
- SNMP RMON Sensor
- Packet Sniffer Sensor
- Flow Sensors
- Windows Network Card Sensor
Get to know everything about bandwidth monitoring here.
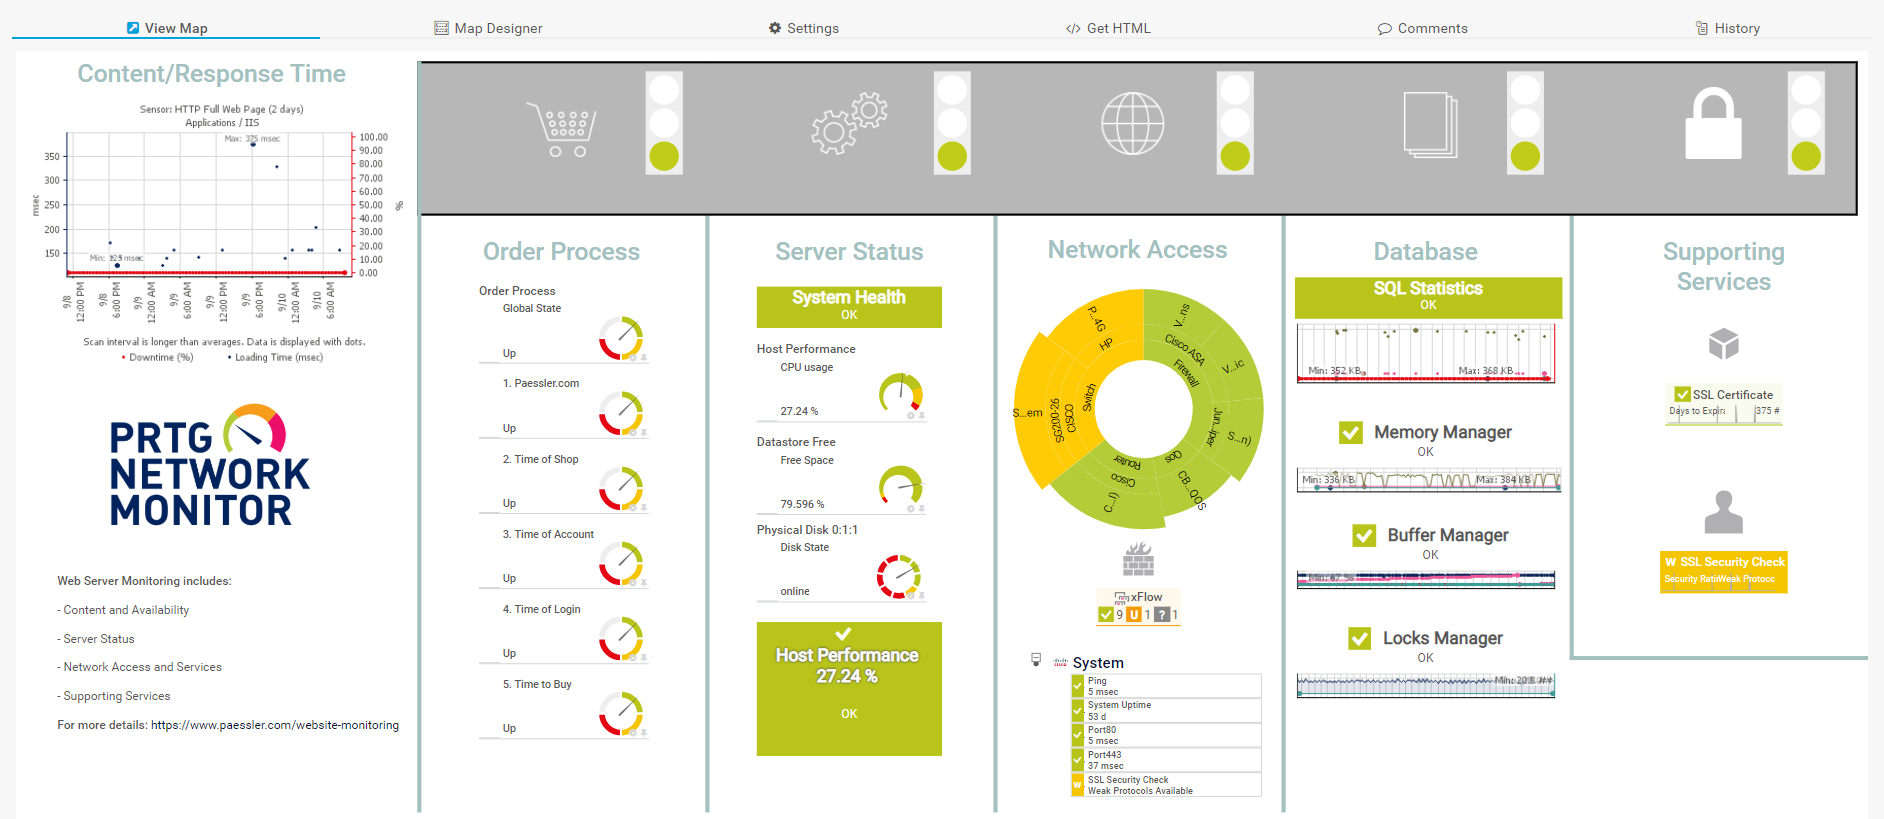
To visualize your critical monitoring data easily, or to share monitoring results with colleagues or customers, use PRTG Maps to create dashboards for each interest group. For example, you can create overview maps for management, or detailed maps for administrators.

Define KPIs
For the decision what to monitor and what to put on a dashboard, you’ll need to determine which KPIs are most relevant to your business. You might want to include the following monitoring values, but these are specific to each environment, so these are only examples:
- Server = CPU and Memory load
- Traffic = Throughput
- Web = Page load time
- SQL = SQL query
- AD = Port response
- DNS = Check a record
- DHCP = IP request
Once you’ve decided on the best KPIs for you, you can determine baseline values for each of these KPIs, and then set up thresholds and alerting for each one. Get your proper baseline by monitoring over a period of time that is long enough.
When you know what KPIs are relevant, then you can define SLAs for each one, and then PRTG can monitor and report on whether you’re meeting the SLAs or not.
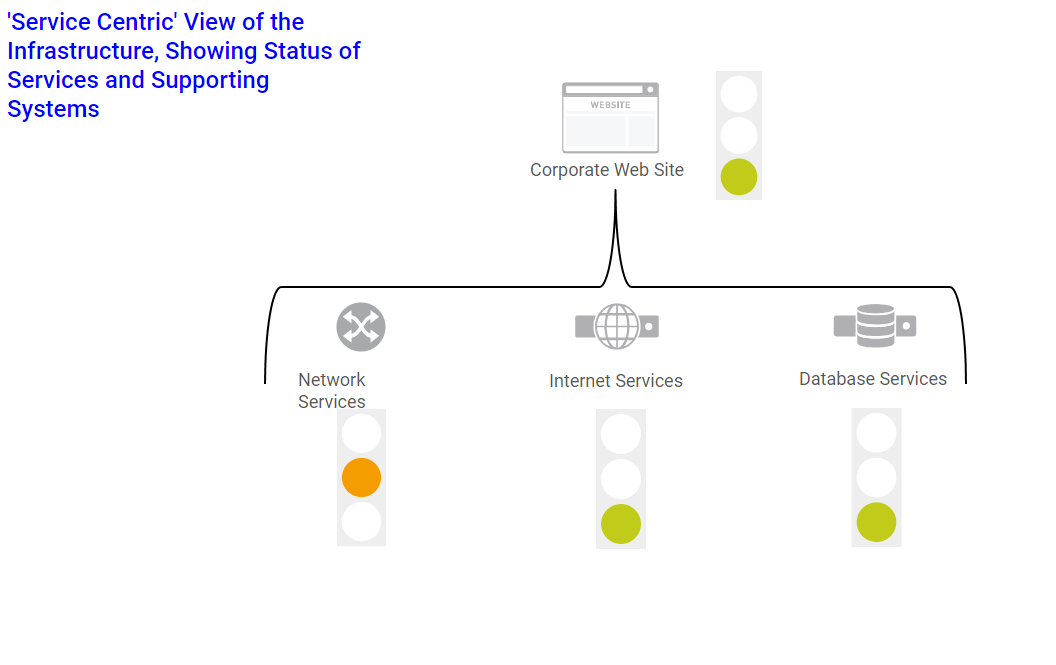
PRTG offers a very powerful sensor that displays all these information at a glance: The Business Process sensor allows you to get an overall status of a whole business process while monitoring several involved process components. For more information about this sensor, please refer to our Knowledge Base.
While admins are generally interested in the states and data of every process component, less technical employees of a company often do not need to see more than the summarized status of a process to know if it works or not.
For example, an accounting manager is okay with the information “Our website works fine”, whereas a business infrastructure manager prefers to get exact information about the involved web servers, databases and other hardware and applications.
Define notifications
- Define notifications (see how-to guide) and escalation steps for critical issues.
- Set up notifications so you get alerts immediately when there’s a problem, and use escalation steps to ensure that critical problems are dealt with promptly.
- You can also use notifications to alert other administrators about planned maintenance.
This how-to guide only scratches the surface?
Get more deep-dive information here!
Get more deep-dive information here!