Our users give top ratings for monitoring with Paessler PRTG


PRTG VMware monitoring:
What you’ll find on this page

PRTG makes monitoring VMware easy
Custom alerts and data visualization make it easy to monitor, identify, and prevent virtual machine performance issues.
3 reasons to use PRTG as your VMware monitoring tool
Keep track of your virtual environment
Virtualization works best if you can keep an eye on CPU load, disk usage, performance, and network utilization of your VMs. If an issue arises there, then there will also be an issue with the virtual machines – which means you'll soon be struggling with compounding problems.
VMware monitoring with Paessler PRTG allows you to keep track of all parts of your virtual environment – from the host server to the applications running on each virtual server.
Be alerted to VMware issues promptly
If too many virtual machines run on one host, it can lead to system overload and performance issues. With PRTG, you can set customized warning and error thresholds (for example, at 75%).
If this threshold is crossed, you’ll quickly receive a notification by email, SMS, push, and more. This way, you’re alerted to problems before your clients or coworkers are aware that anything is wrong.
Optional hosted infrastructure monitoring
PRTG is also available as a hosted monitoring solution (Monitoring as a Service). You can easily get the cloud-based tool up and running within minutes, and it offers the full range of features.
With our comprehensive PRTG VMware monitoring tools – on premises or in the cloud – any potential trouble spots will be instantly visible so you can take quick action.
What VMware monitoring looks like in PRTG
Diagnose network issues by continuously monitoring your VMware vSphere performance and the health of your VMware ESXi servers. Show VM monitoring stats in real time and visualize data in graphic maps & dashboards to identify problems more easily. Gain the visibility you need to troubleshoot VMware virtual machines and devices.
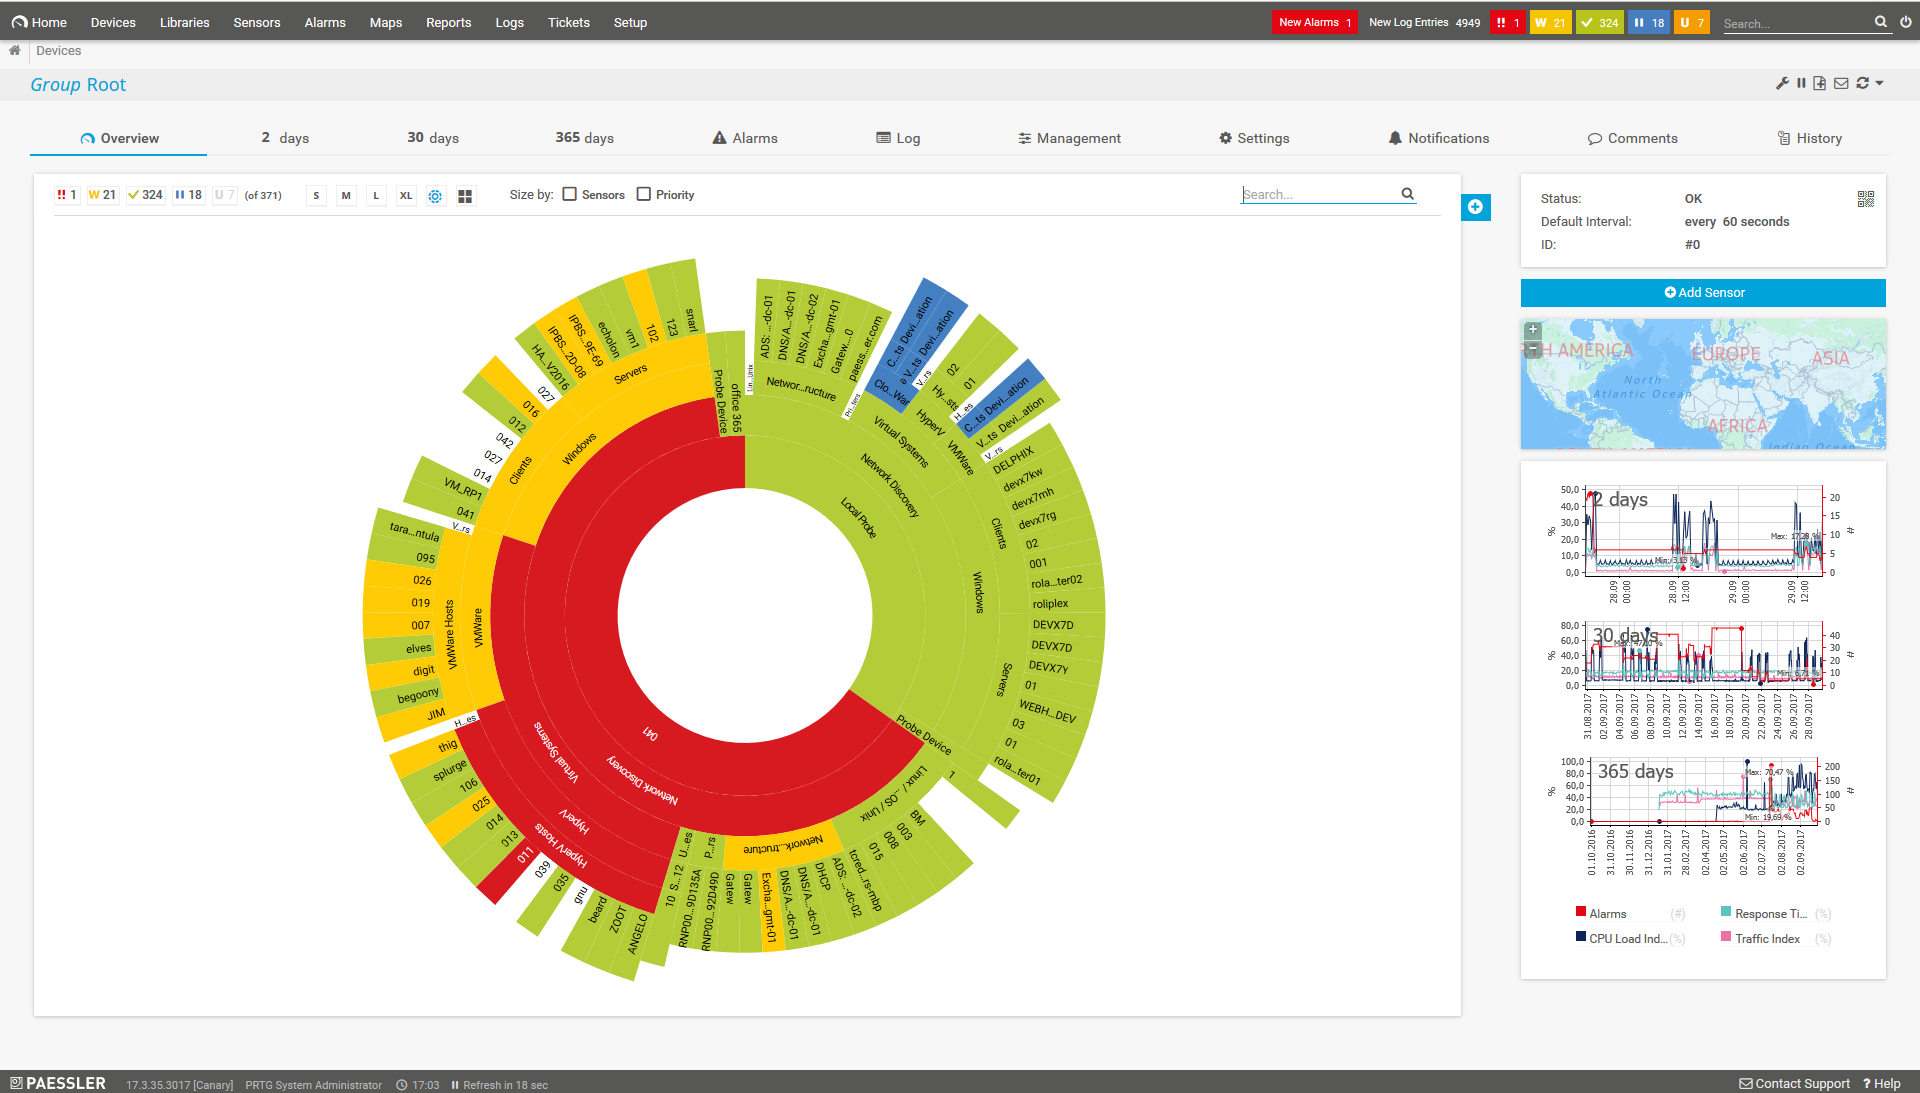
Sunburst view of the entire monitoring setup
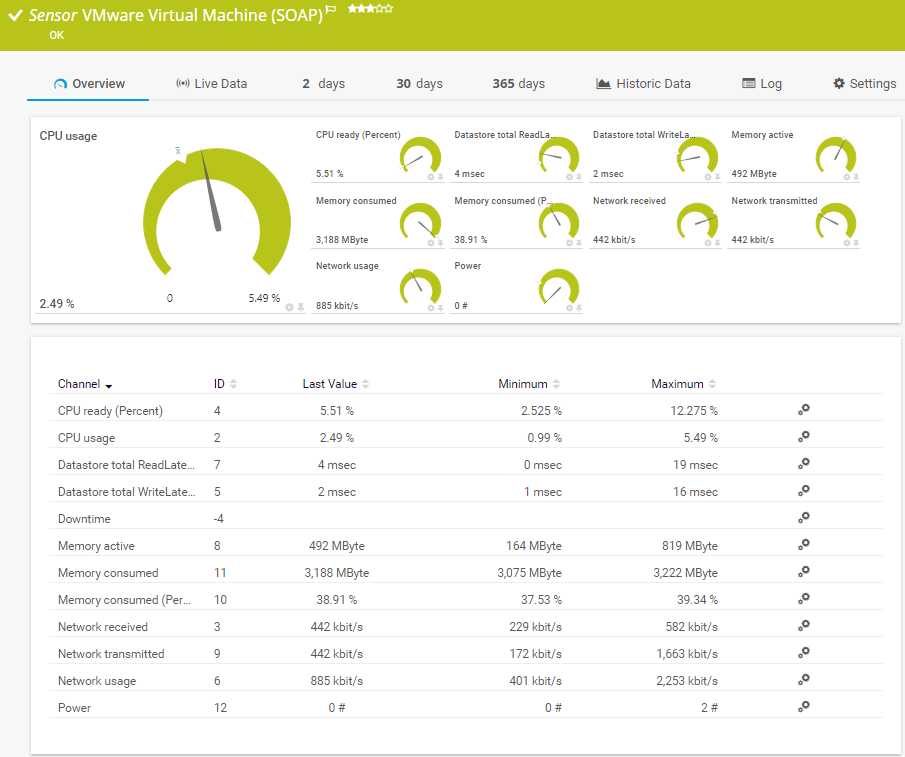
VMware Virtual Machine (SOAP) sensor in PRTG
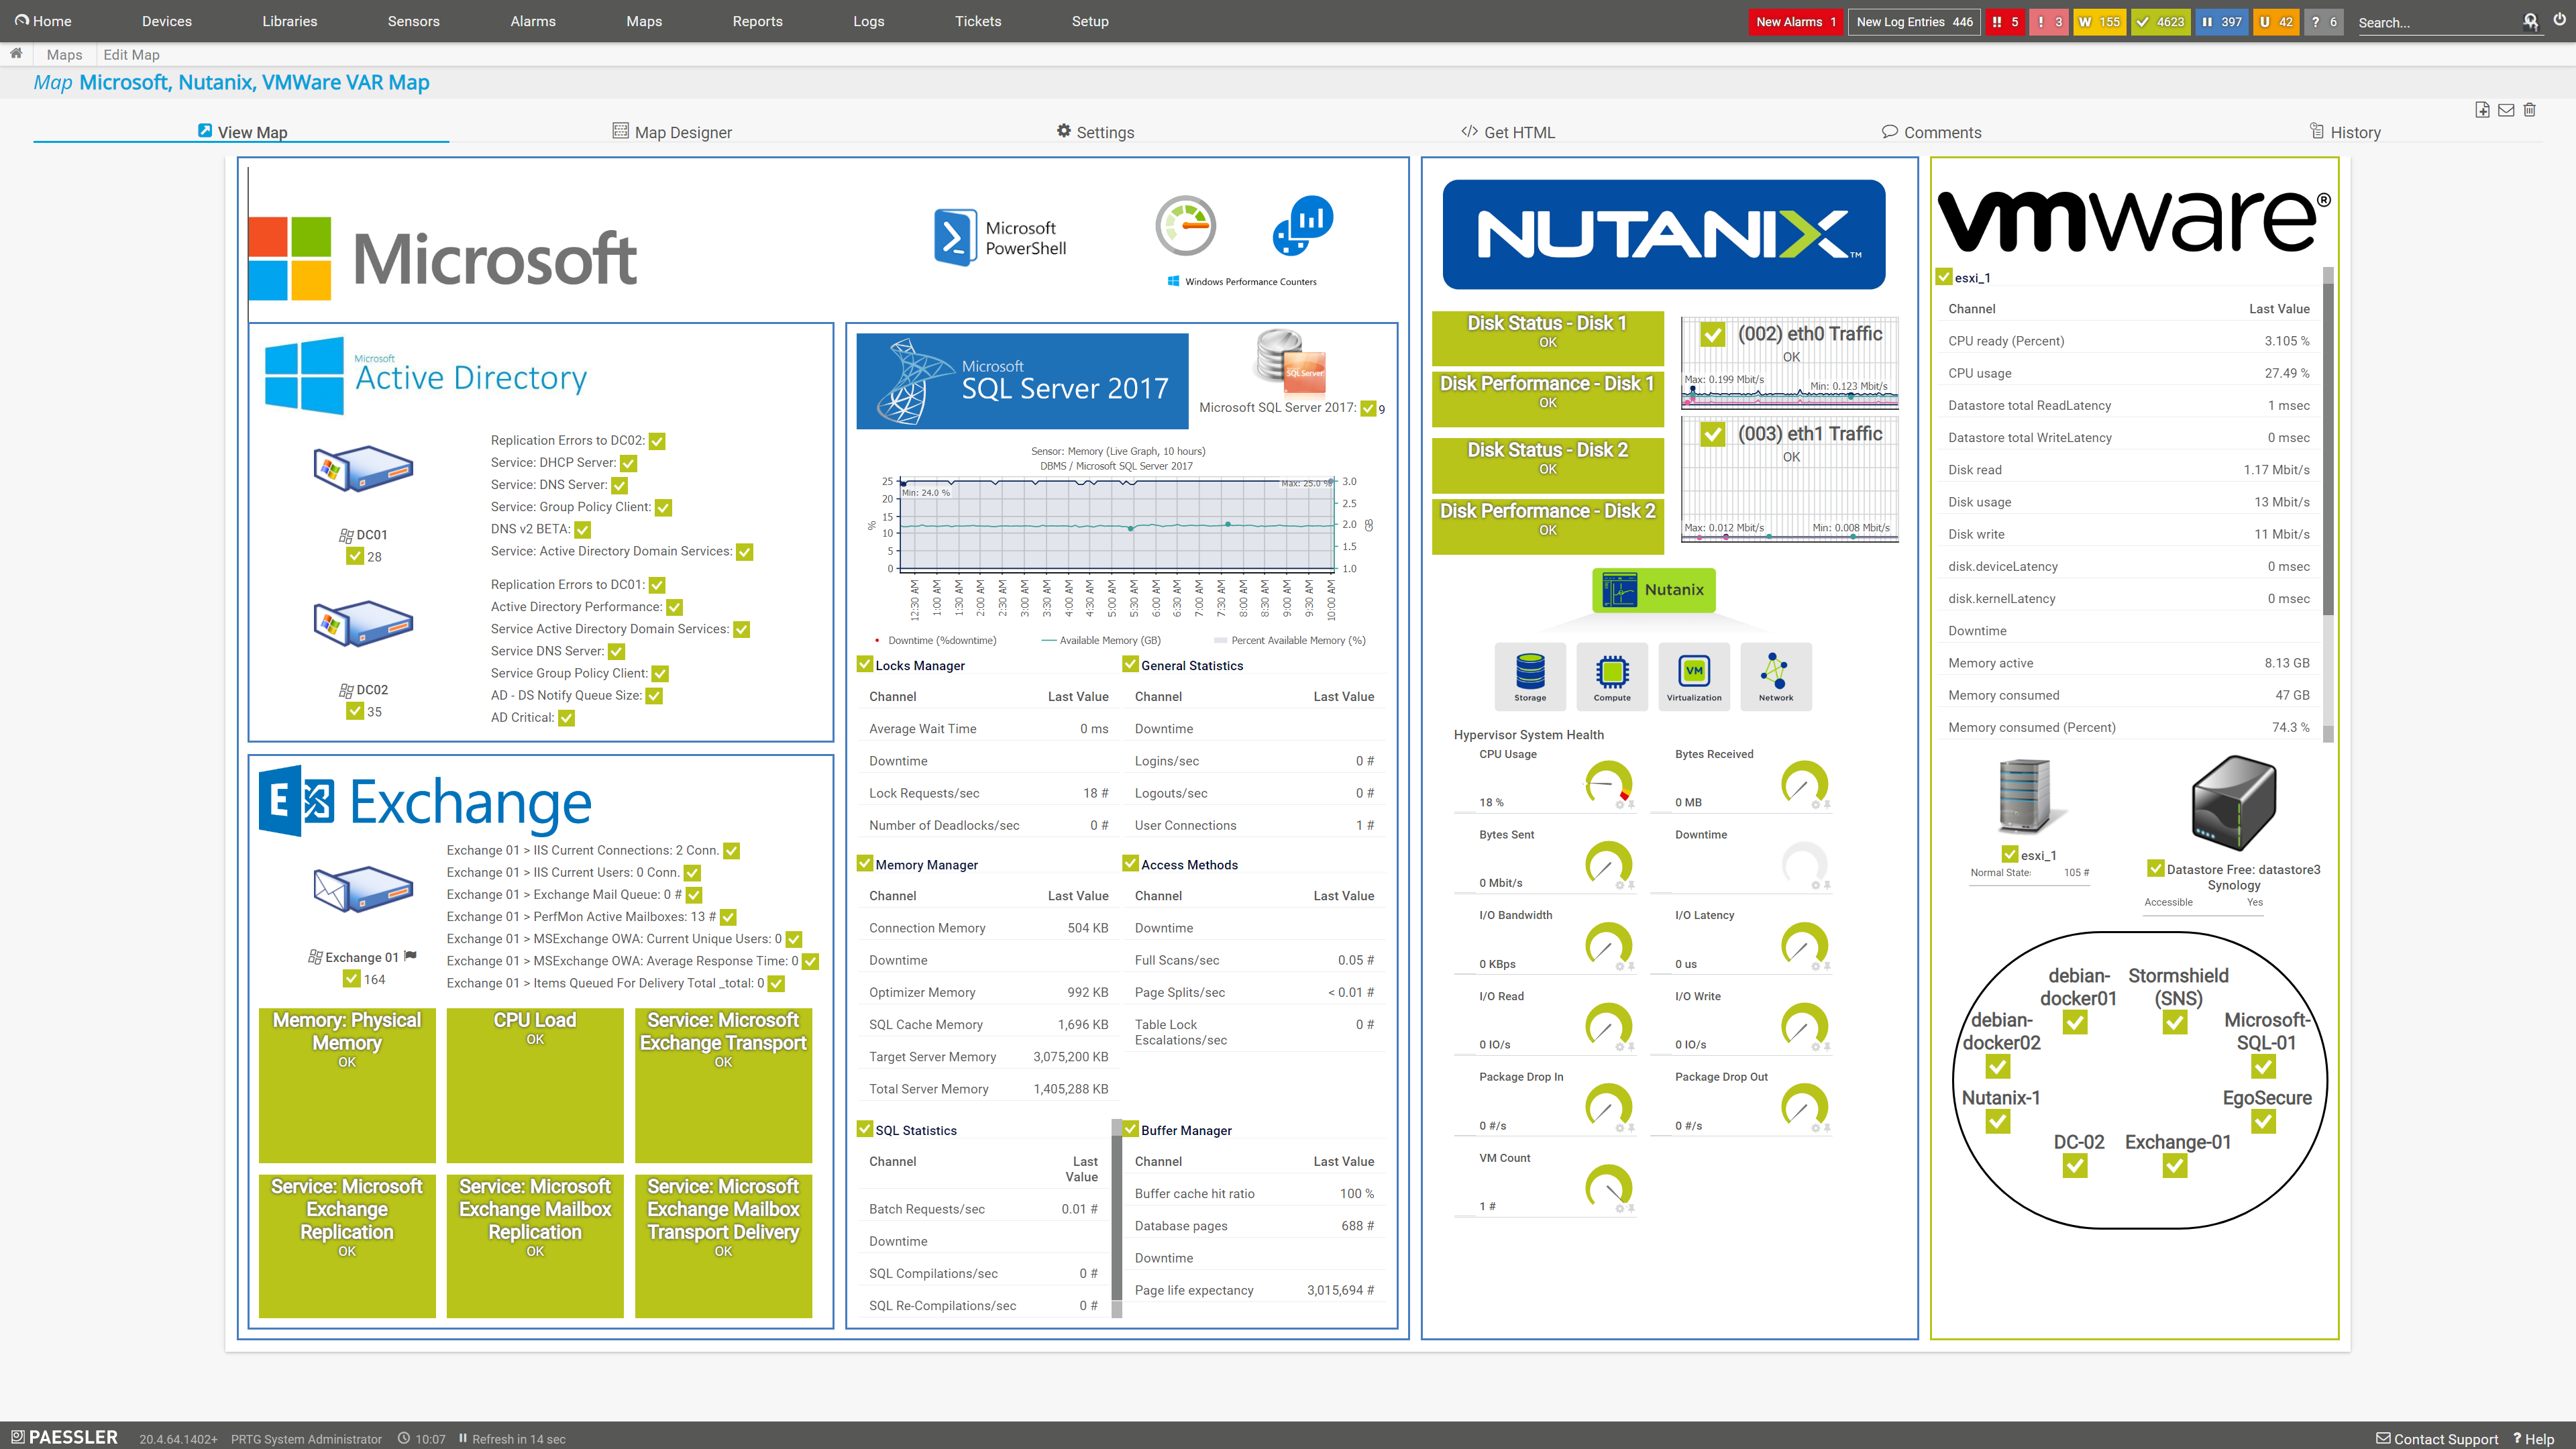
Custom PRTG dashboard for monitoring virtualized environments
PRTG is compatible with all major vendors, products, and systems
![]()
Easily find the source of the problem with our PRTG VMware monitoring solution
Real-time alerts and custom notifications make it easy to solve issues with your virtual infrastructure.
PRTG is a VMware Certified Technology Partner
Paessler PRTG has achieved VMware's highest level of endorsement due to our technological excellence, leading market position, and superior compatibility with VMware products.
As a member of the VMware Technology Alliance Program, our software has passed VMware's testing and review process and works effectively with VMware infrastructure.
But what does this mean for you? It means we have the expert insight to deliver the best VMware monitoring experience in the world.
In fact, we use VMware for our own environments every day. This gives us a deep understanding of an administrator's problems and needs so we can provide intuitive, easy-to-use VMware monitoring.
Preconfigured VMware monitoring sensors from PRTG
Our specific device templates and customizable sensors make it easy to integrate our VMware monitoring software into your infrastructure. This means PRTG can easily monitor every detail of your virtual VMware environment. The following sensors are available for monitoring VMware.
VMware Virtual Machine (SOAP)
The VMware Virtual Machine (SOAP) sensor monitors a VM on a VMware host server via SOAP. It displays a single virtual machine's CPU load and memory usage, disk read and write speed, and network transmission speed.
VMware Host Hardware (WBEM)
The VMware Host Hardware (WBEM) sensor enables you to monitor the performance of an ESX/ESXi server via WBEM. It displays the host server's temperature, current power consumption, fan rotations per minute (RPM), battery voltage, and health status.
VMware Host Hardware Status (SOAP)
The VMware Host Hardware Status (SOAP) sensor monitors the health of your host system via SOAP. It displays the total number of objects in "normal", "warning", and "alert" status just like the vSphere client reports.
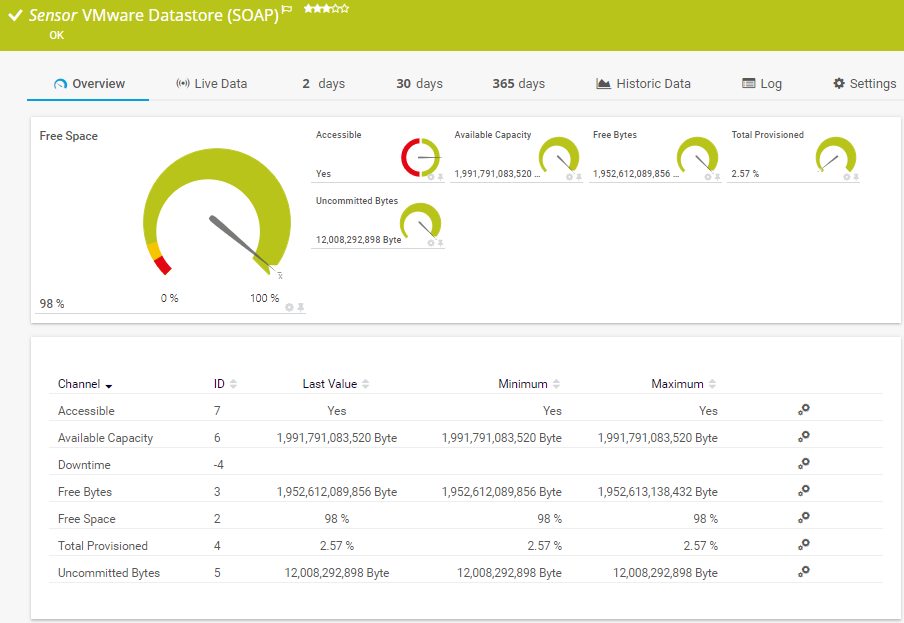
VMware Datastore (SOAP)
The VMware Datastore (SOAP) sensor monitors the disk usage of a VMware datastore via SOAP. It displays the accessibility of the datastore, the available capacity (the physically or virtually available size), and the free space (the disk space that is not used by VMs; used disk space can be either thick-provisioned or used by thin-provisioned virtual disks).
VMware Host Performance (SOAP)
The VMware Host Performance (SOAP) sensor monitors vSphere performance via SOAP. It displays CPU readiness and usage, read and write latency, disk read and write speed, active and consumed memory, received and transmitted bytes, total network usage, and the average host power usage.
Dell EMC Unity VMware Datastore v2
The Dell EMC Unity VMware Datastore v2 sensor monitors a VMware datastore on a Dell EMC storage system via the REST API. It displays the free size, the number of hosts, the total size, the number of virtual drives, and the number of virtual machines.
ESXi and VM monitoring
Although our sensors for monitoring ESXi host hardware servers work only directly with your VMware ESX 5+ server and its parent devices, you can also use the VMware Virtual Machine (SOAP) sensor to monitor your virtual machines in two different ways:
- To communicate directly with a VMware ESXi host server to monitor the virtual machines running on it
- To communicate with a VMware vCenter installation to monitor all the virtual machines managed by the vCenter server
Monitoring the vCenter server allows you to continue to monitor virtual machines directly, even after they change physical hosts with vMotion.
IT experts agree: Paessler PRTG is a great solution for IT infrastructure monitoring

“All-around winning
network monitor”

“The real beauty of PRTG is the endless possibilities it offers”

“Outstanding cloud
monitoring”
Start VMware performance monitoring with PRTG and see how it can make your network more reliable and your job easier.
Why use PRTG VMware monitoring software instead of VMware vRealize?

Unlike VMware vRealize Operations, PRTG offers monitoring of your virtual machines on different levels and keeps track of your physical servers, server hardware, and much more.
Another advantage is that PRTG allows you to monitor all the other elements and services in your network, such as the bandwidth usage of your applications, the availability and performance of your websites, and the available disk space of your network drives.
Your VMware monitor at a glance – even on the go
Set up PRTG in minutes and use it on almost any mobile device.


“Excellent tool for detailed monitoring. Alarms and notifications work greatly. Equipment addition is straight forward and server initial setup is very easy. ...feel safe to purchase it if you intend to monitor a large networking landscape.”
Infrastructure and Operations Engineer in the Communications Industry, firm size 10B - 30B USD
Easily find the source of the problem with our PRTG VMware monitoring solution
Real-time alerts and custom notifications make it easy to solve issues with your virtual infrastructure.
Monitor VMware: FAQ
1. What is VMware?
VMware is a leading virtualization and cloud computing software company. It provides a range of products and solutions for virtualizing computing, networking, storage, and management resources in data centers. VMware's flagship product is its virtualization platform, which allows multiple operating systems to run on a single physical server concurrently.
2. What is VMware monitoring?
VMware monitoring allows you to keep a constant eye on important application and performance data of your virtual machines. This includes parameters like CPU load, memory usage or downtime. By monitoring VMware, you are always up to date with the performance of your virtual machines.
3. Why should I monitor my VMware virtual machines?
Monitoring virtual machines is essential for maintaining optimal performance, ensuring the reliability of services, and making informed decisions about resource allocation and capacity planning in virtualized environments.
VMware virtual machine monitoring with PRTG allows you to keep track of all parts of your virtual environment – from the host server to the applications running on each VM.
4. Why is virtualization important?
Virtualization using VMware products, for example, is a crucial part of many IT environments and an effective way to reduce expenses while boosting efficiency and flexibility of your business. It allows you to distribute applications and databases over different servers, networks, and locations. To avoid downtimes and ensure a good overall performance, you should monitor your VMware servers and all of your virtual machines.
5. What is a sensor in PRTG?
In PRTG, “sensors” are the basic monitoring elements. One sensor usually monitors one measured value in your network, for example the traffic of a switch port, the CPU load of a server, or the free space on a disk drive.
On average, you need about 5-10 sensors per device or one sensor per switch port.
More than just a monitoring tool:
Reasons our customers love PRTG


Still not convinced?
![]()
More than 500,000
sysadmins love PRTG
Paessler PRTG is used by companies of all sizes. Sysadmins love PRTG because it makes their job a whole lot easier.
![]()
Monitor your entire IT infrastructure
Bandwidth, servers, virtual environments, websites, VoIP services – PRTG keeps an eye on your entire network.
![]()
Try Paessler PRTG
for free
Everyone has different monitoring needs. That’s why we let you try PRTG for free.
![]()
Start VMware performance monitoring with PRTG and see how it can make your network more reliable and your job easier.
|
PRTG |
Network Monitoring Software - Version 24.2.94.1400 (April 10th, 2024) |
|
Hosting |
Download for Windows and cloud-based version PRTG Hosted Monitor available |
Languages |
English, German, Spanish, French, Portuguese, Dutch, Russian, Japanese, and Simplified Chinese |
Pricing |
Up to 100 sensors for free (Price List) |
Unified Monitoring |
Network devices, bandwidth, servers, applications, virtual environments, remote systems, IoT, and more |
Supported Vendors & Applications |
|
Combining the broad monitoring feature set of PRTG with IP Fabric’s automated network assurance creates a new level of network visibility and reliability.